If your paper uses a multi-item scale — a five-question survey, a set of Likert items, anything where multiple observations combine into one construct — you have probably reported Cronbach’s α. And your reviewer has probably asked whether it is above 0.70.
Here is what α is, what it is not, and the three mistakes that keep sneaking through peer review.
What α measures
Formally, α estimates the average correlation between all possible split-halves of your scale. In practice, it tells you how much the items in your scale “agree” with each other — how internally consistent they are.
An α of 0.85 means your scale items are highly correlated with each other. An α of 0.30 means they are barely related. That is the whole idea.
Notice what α does not measure:
- whether the items measure one thing (dimensionality);
- whether the items measure the right thing (validity);
- whether the scale is a good scale overall.
α is a reliability index, not a validity index. Necessary, not sufficient.
Thresholds (and why they are contested)
The most-cited benchmarks (Nunnally, 1978):
- α ≥ 0.90 — excellent, but suspiciously so; often signals redundant items;
- α ≥ 0.80 — good;
- α ≥ 0.70 — acceptable for research scales;
- α ≥ 0.60 — acceptable only for exploratory research.
Above 0.95, the items are often near-duplicates and the scale is padded. Below 0.60, items do not hang together — either a poor scale, or multiple constructs mixed in the same instrument.
Three mistakes to avoid
1. Confusing α with unidimensionality. α can be perfectly acceptable for a scale that measures two different things. If items 1-3 correlate strongly with each other AND items 4-6 correlate strongly with each other AND the two groups do not correlate at all, α can still exceed 0.70. Always run an EFA or CFA alongside α to confirm the scale is unidimensional.
2. Inflating α by adding items.
The Spearman-Brown formula shows that α grows mechanically with the
number of items. You can raise α from 0.65 to 0.80 by adding items
alone, without improving the quality of the scale. Always report α
with k (the number of items) visible so readers can judge.
3. Reporting α when its assumptions do not hold. α assumes tau-equivalence — that every item measures the underlying construct with equal weight. Real scales rarely meet this. Modern practice recommends reporting composite reliability (ρ_C) or Dijkstra-Henseler’s rho (ρ_A) alongside α. Both handle unequal factor loadings and give more honest reliability estimates.
What to report
For a modern applied paper:
- Cronbach’s α, with the number of items, e.g.
α = 0.82, k = 6. - Composite reliability ρ_C.
- Optionally ρ_A, especially in PLS-SEM contexts.
- Optionally the “α if item deleted” for each item, so weak items are visible to reviewers.
Doing this in AnalyVa
A full workflow, from a fresh canvas to a saved Excel report.
Step 1 — Open AnalyVa. Launch the app. You start on an empty canvas, ready to receive data.

Step 2 — Click Import. Top toolbar, second button from the left. This opens the data-import dialog.

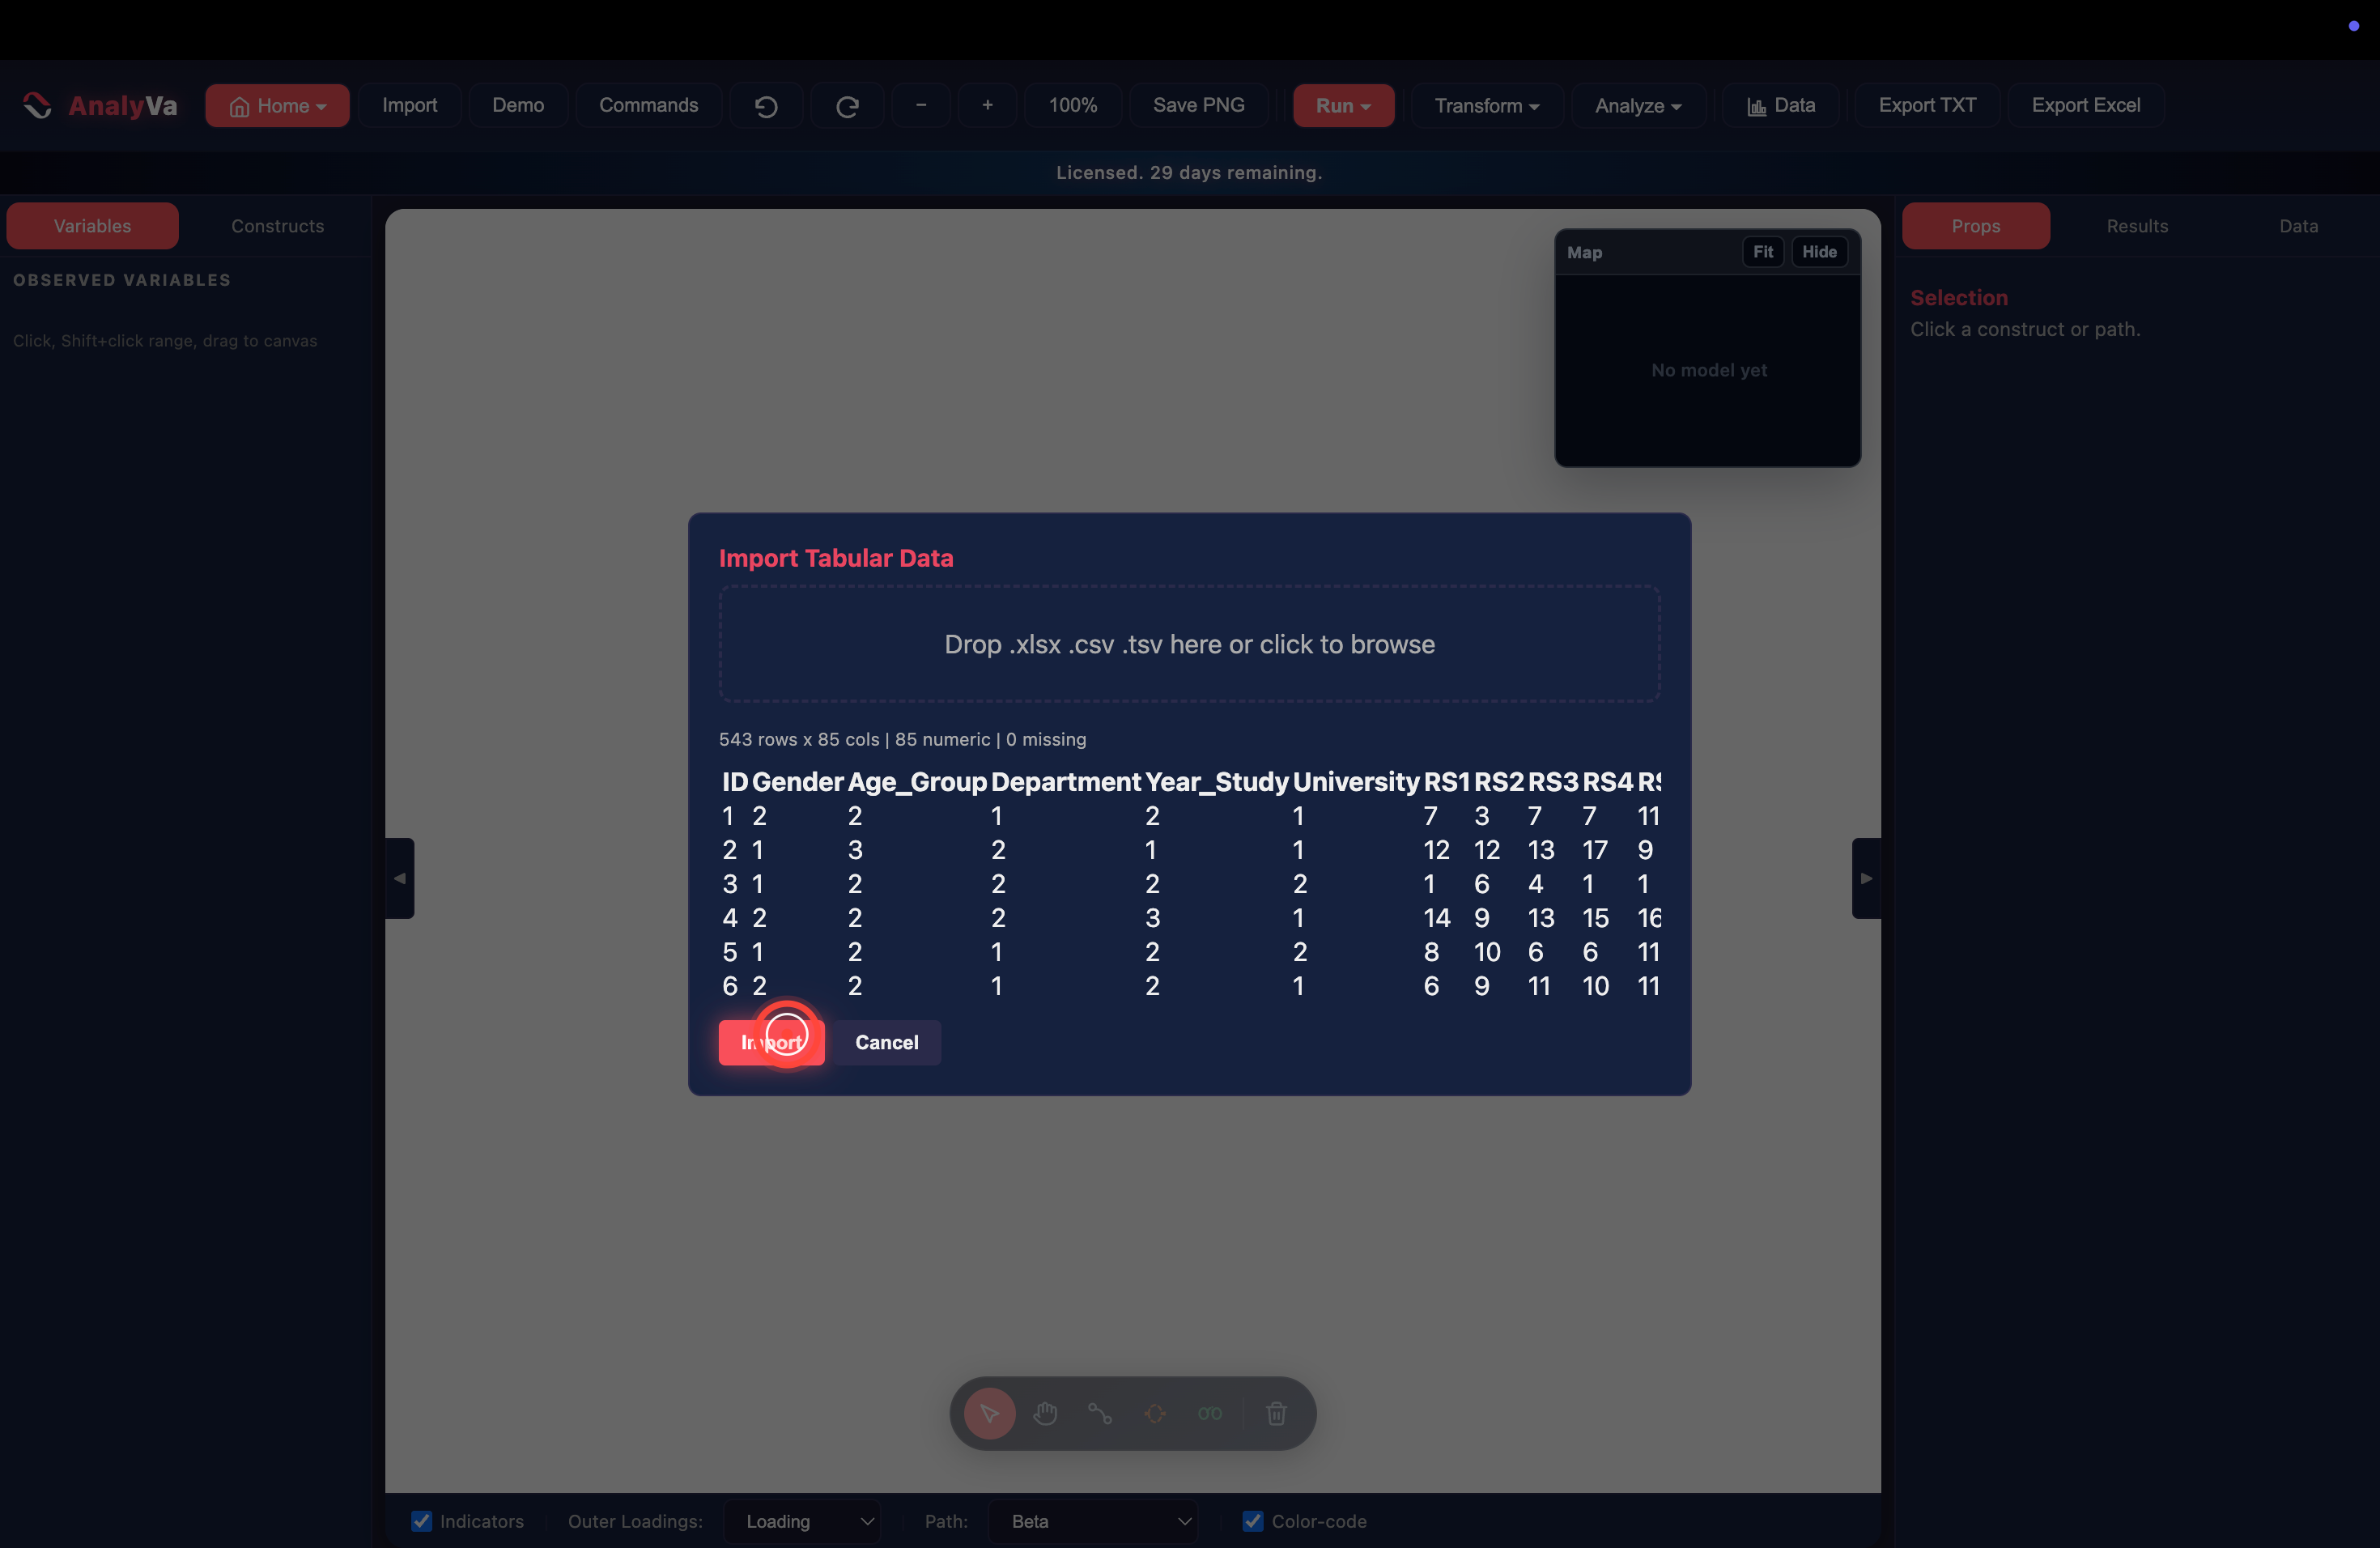
Step 3 — Drop your data file.
Drag an .xlsx, .csv, or .tsv file onto the drop zone (or click to
browse). AnalyVa parses the file, shows you the first few rows for
sanity-checking, and reports the shape (here: 543 rows × 85 columns,
all numeric, no missing values). Click Import to load it in.
Step 4 — Open Analyze → Scale → Reliability Analysis. Every variable in your dataset now appears in the left sidebar. Open the Analyze menu in the top toolbar → Scale → Reliability Analysis.

Step 5 — The item picker opens. A dialog appears asking you to select the items that make up your scale. All four reporting extras (item-total statistics, split-half reliability, McDonald’s ω, inter-item correlation matrix) are enabled by default — leave them all checked.
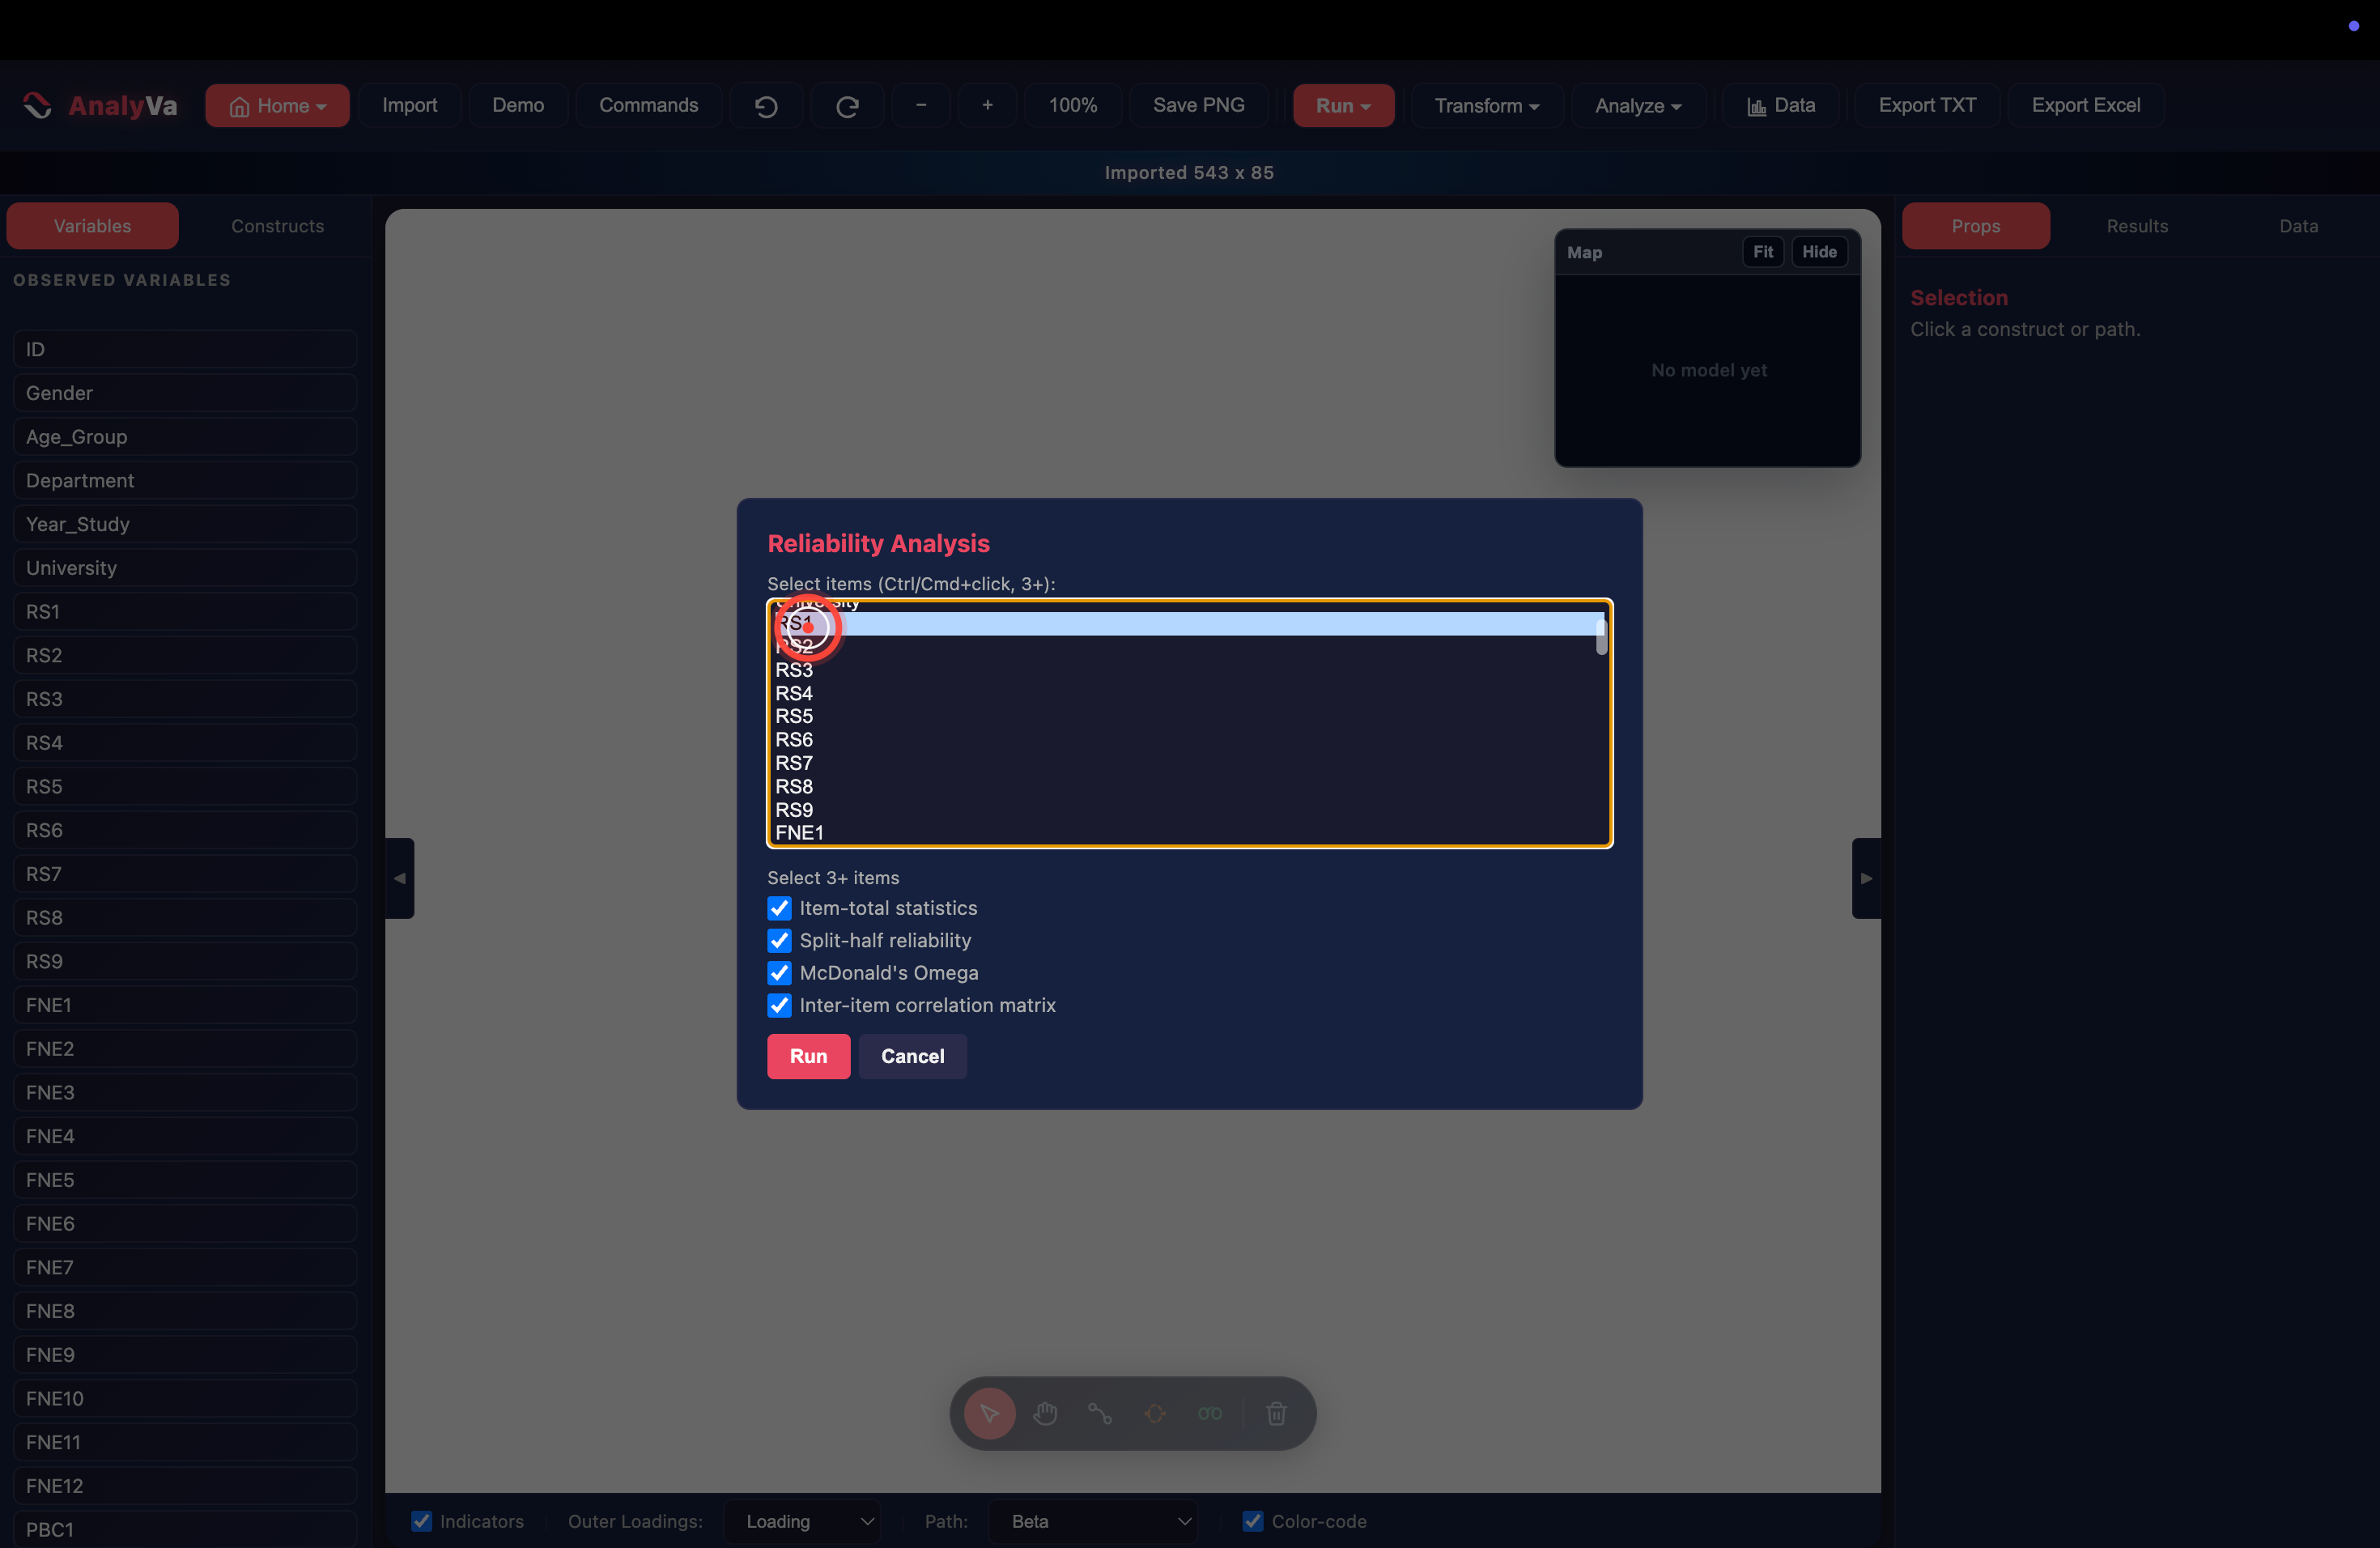
Step 6 — Click the first item in your scale.
The item you click is highlighted. This example uses the RS scale
(items RS1 through RS9 — a 9-item risk-perception scale).
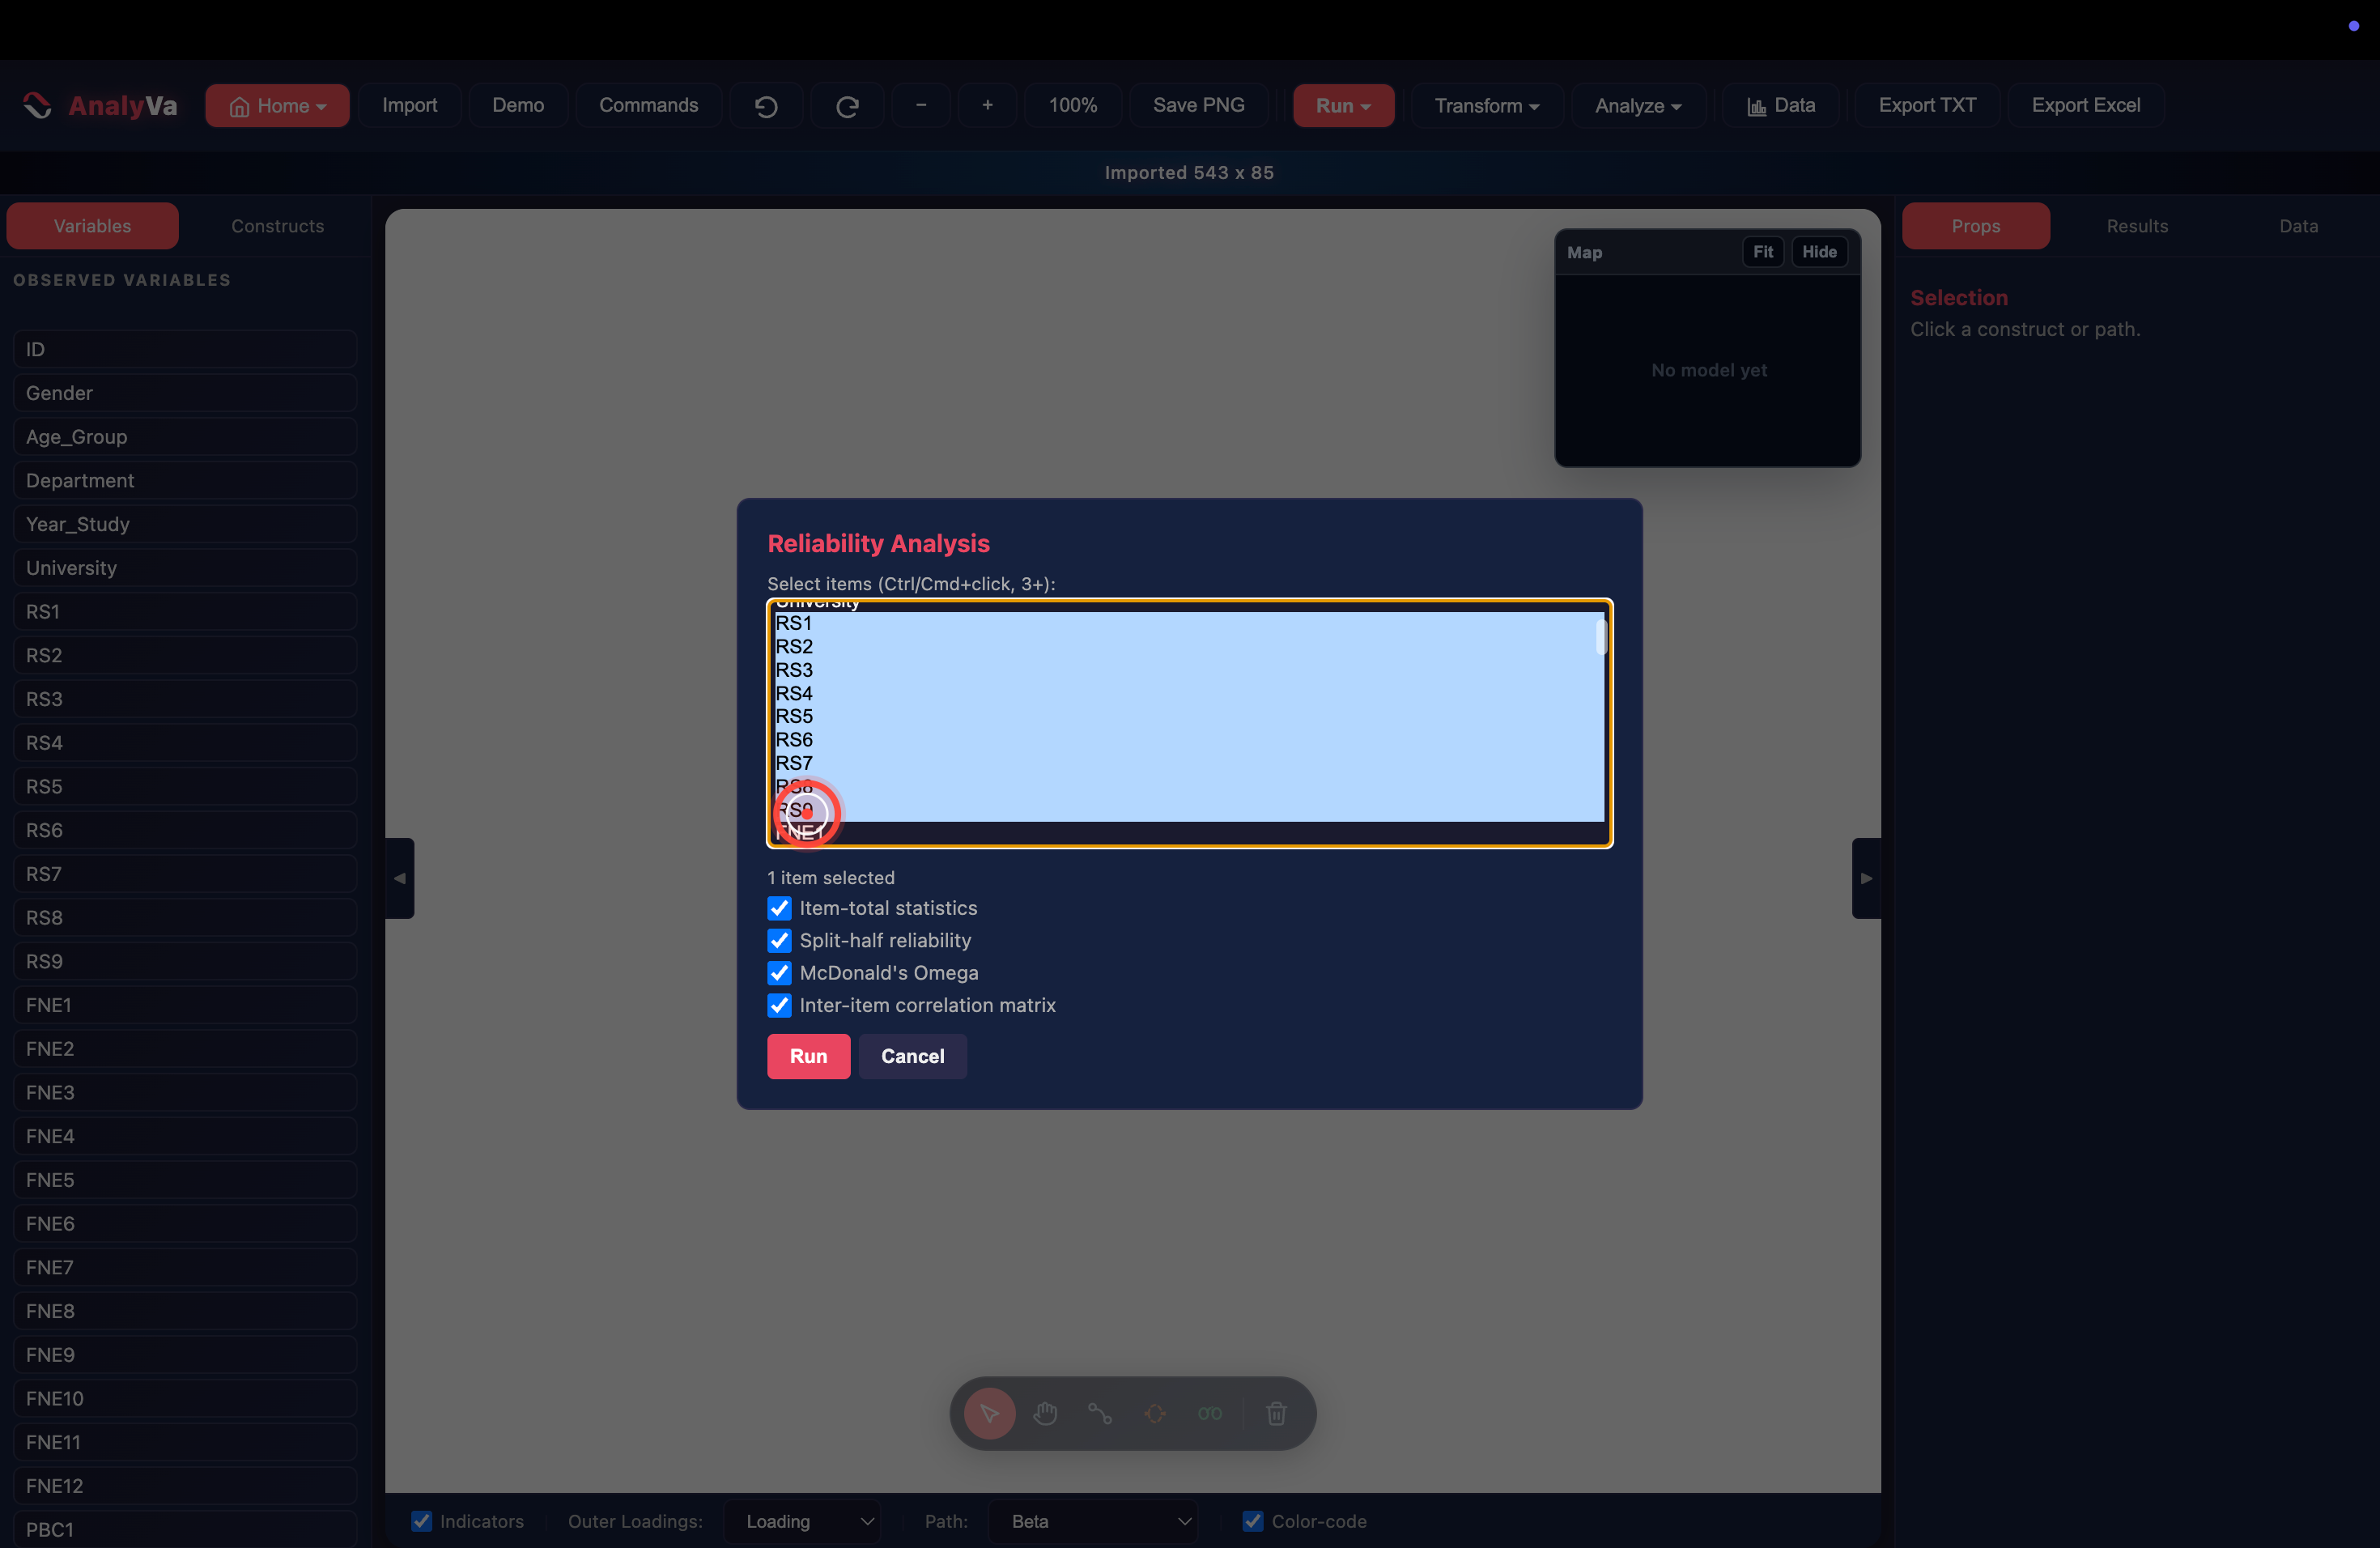
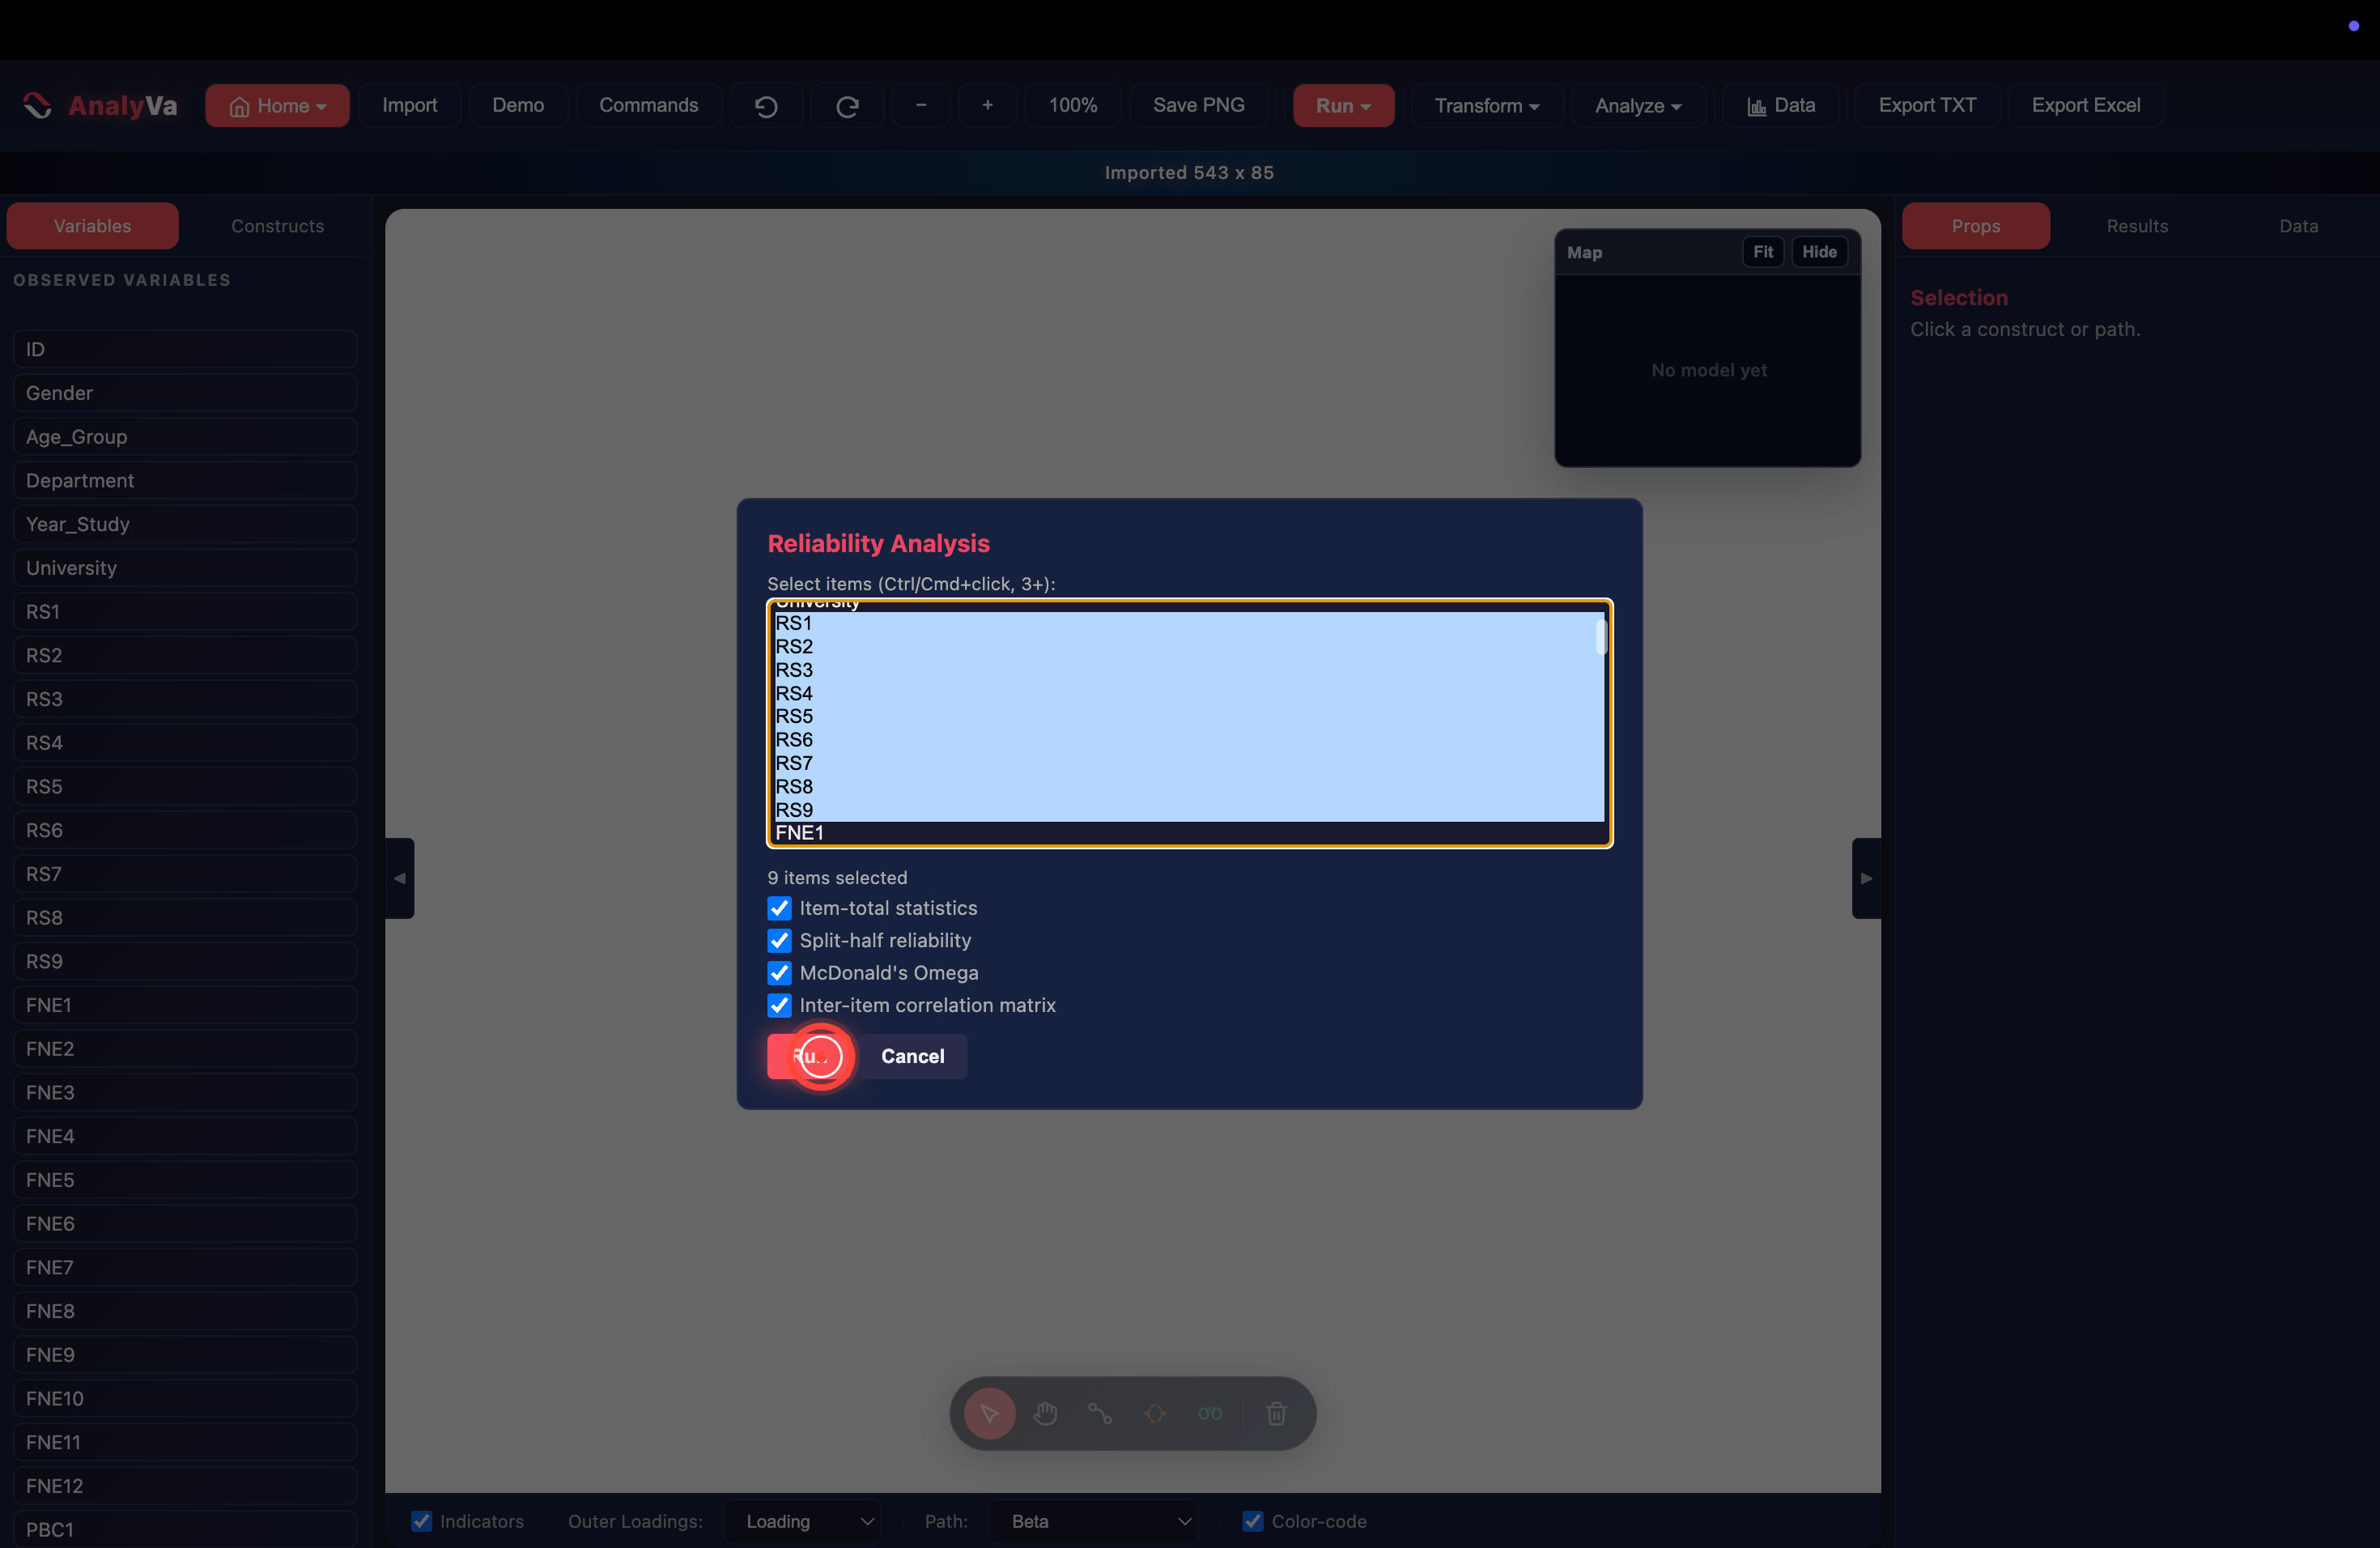
Step 7 — Ctrl/Cmd-click through the remaining items, then Run. Hold Ctrl (Windows) or Cmd (Mac) and click each additional scale item. Or click the first and Shift-click the last to select the whole range. Once all 9 items are highlighted, click the red Run button at the bottom-left of the dialog.
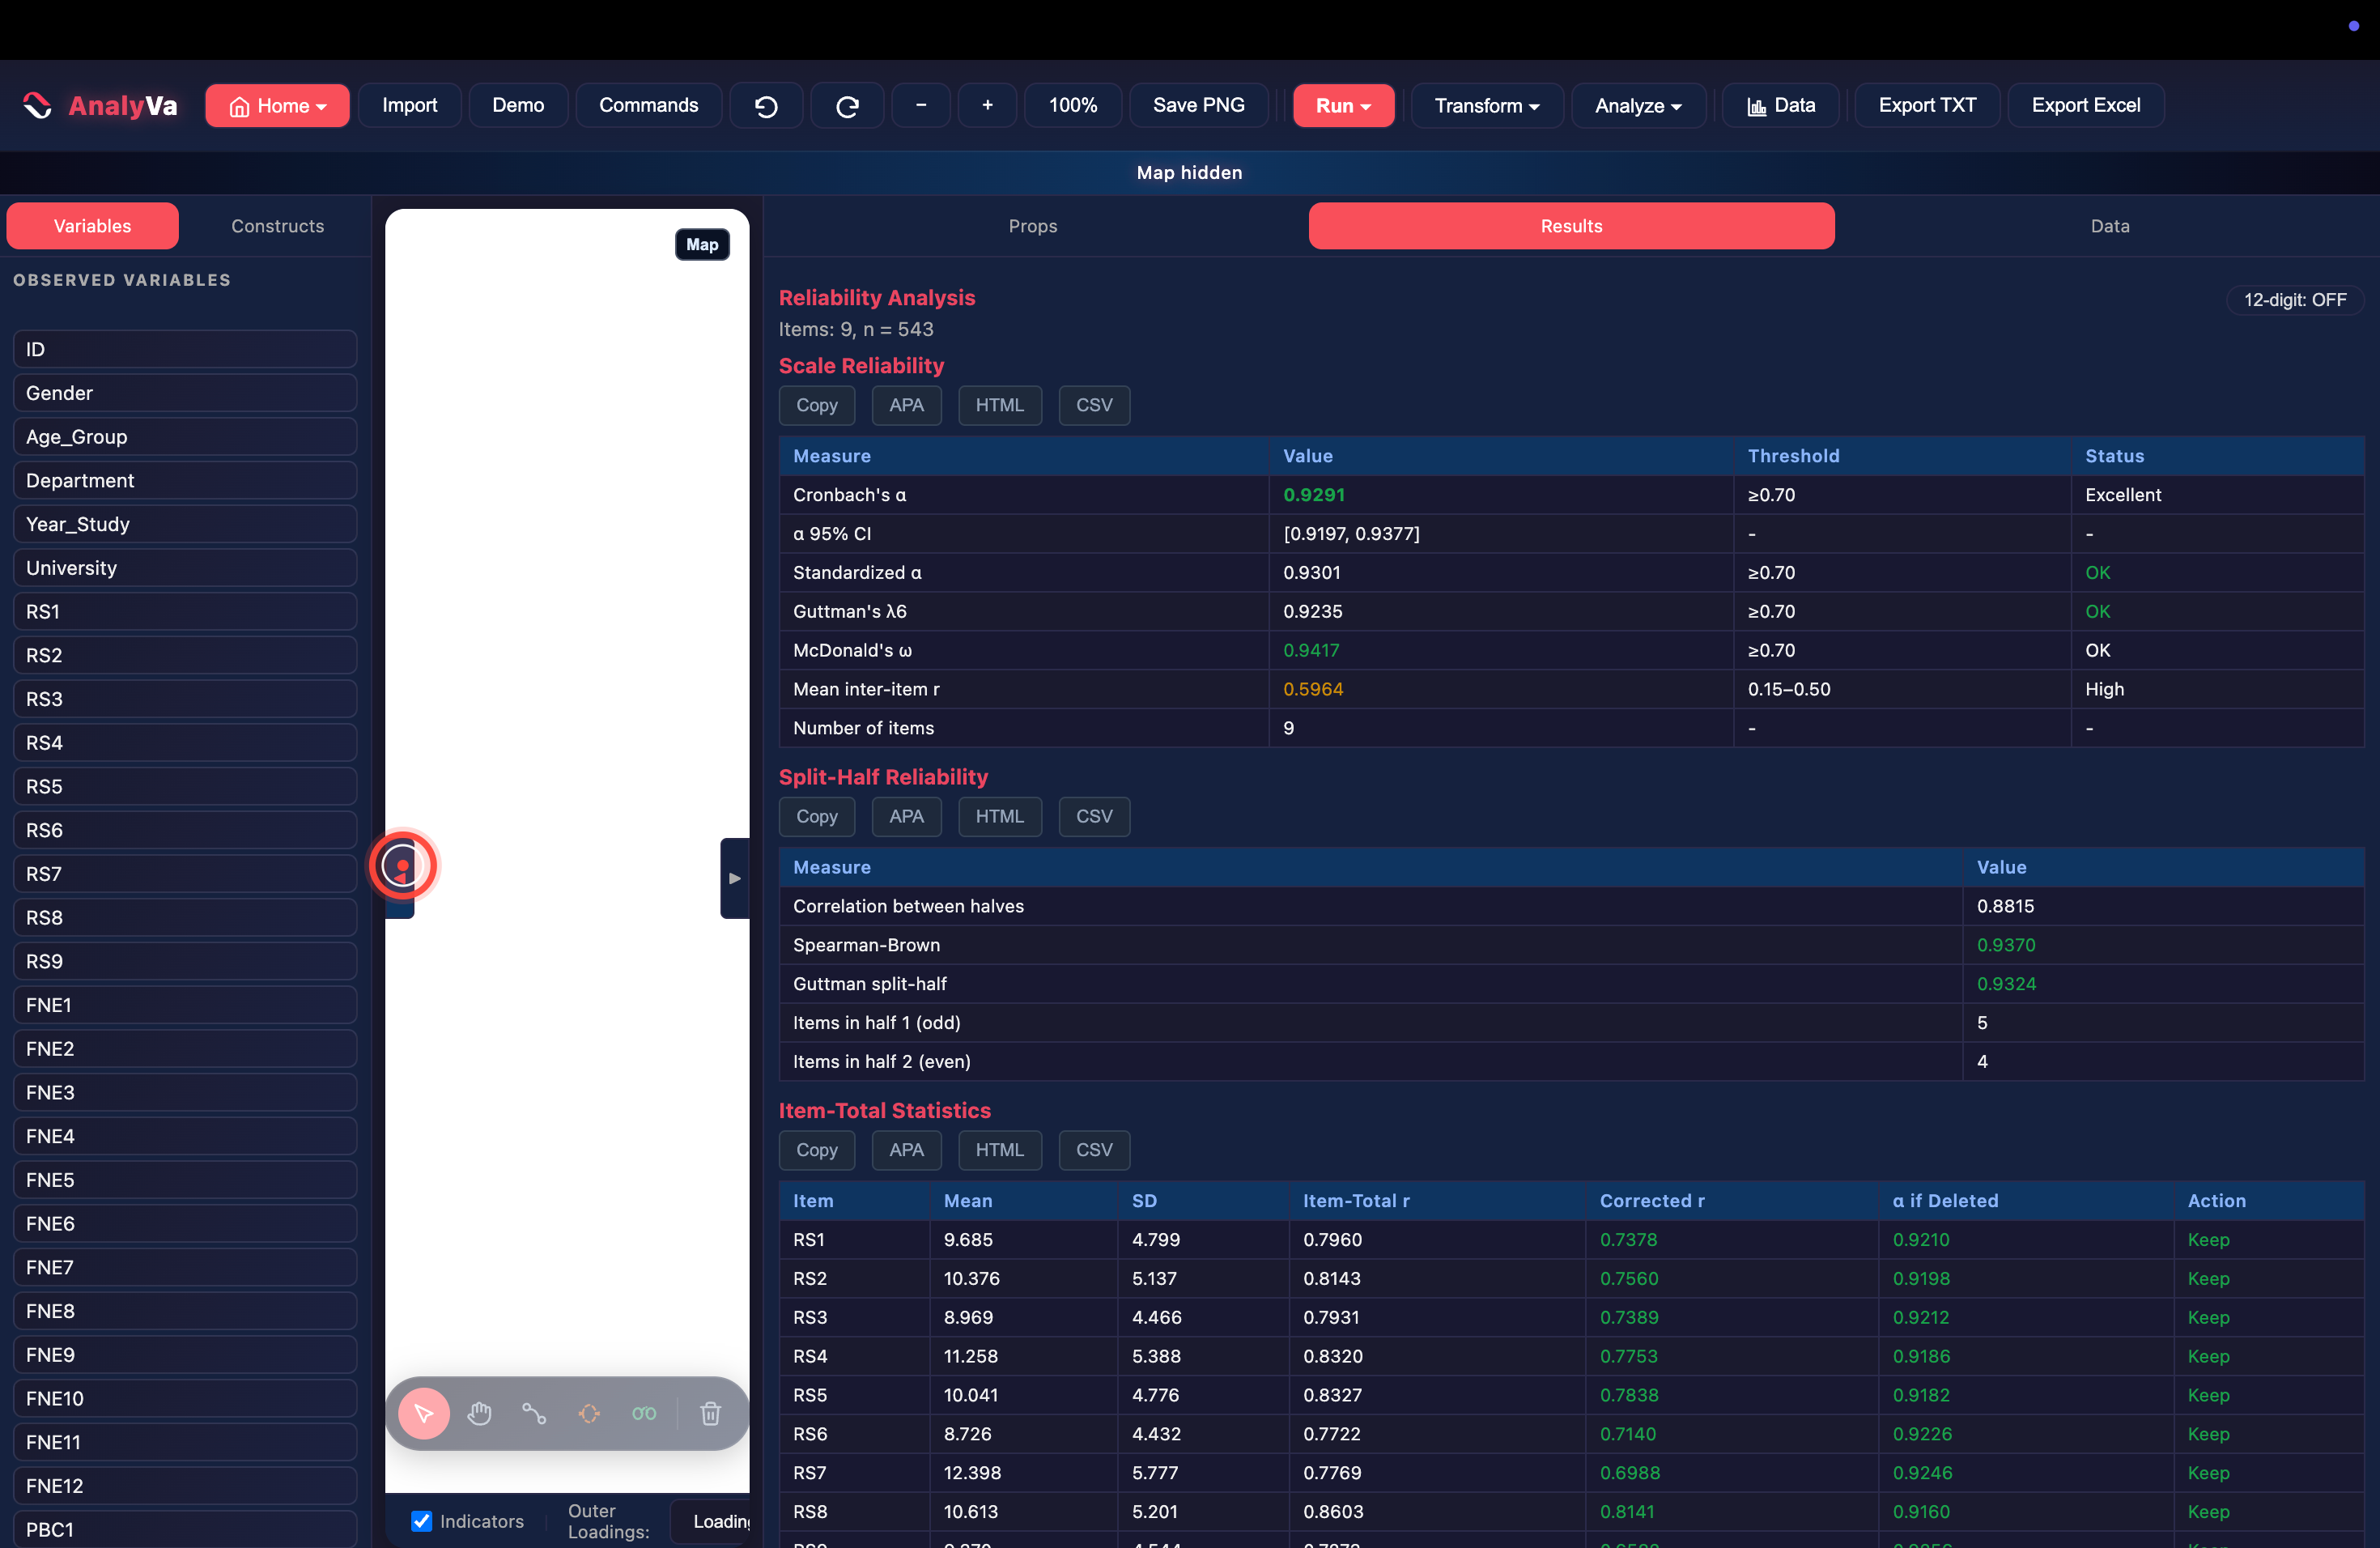
Step 8 — Read the results panel. The right pane switches to Results. Cronbach’s α, its 95% confidence interval, standardised α, Guttman’s λ6, McDonald’s ω, and the mean inter-item correlation all appear in one Scale Reliability table — each labelled with its threshold and a colour-coded status (Excellent / OK / High). Below it, the Split-Half Reliability table (Spearman-Brown, Guttman split-half) and the Item-Total Statistics table with the “α if item deleted” column and a Keep / Drop recommendation for each item.
In this example: α = 0.9291 (95% CI [0.9197, 0.9377]), McDonald’s ω = 0.9417 — both well above 0.70 → Excellent.
Step 9 — Export the report.
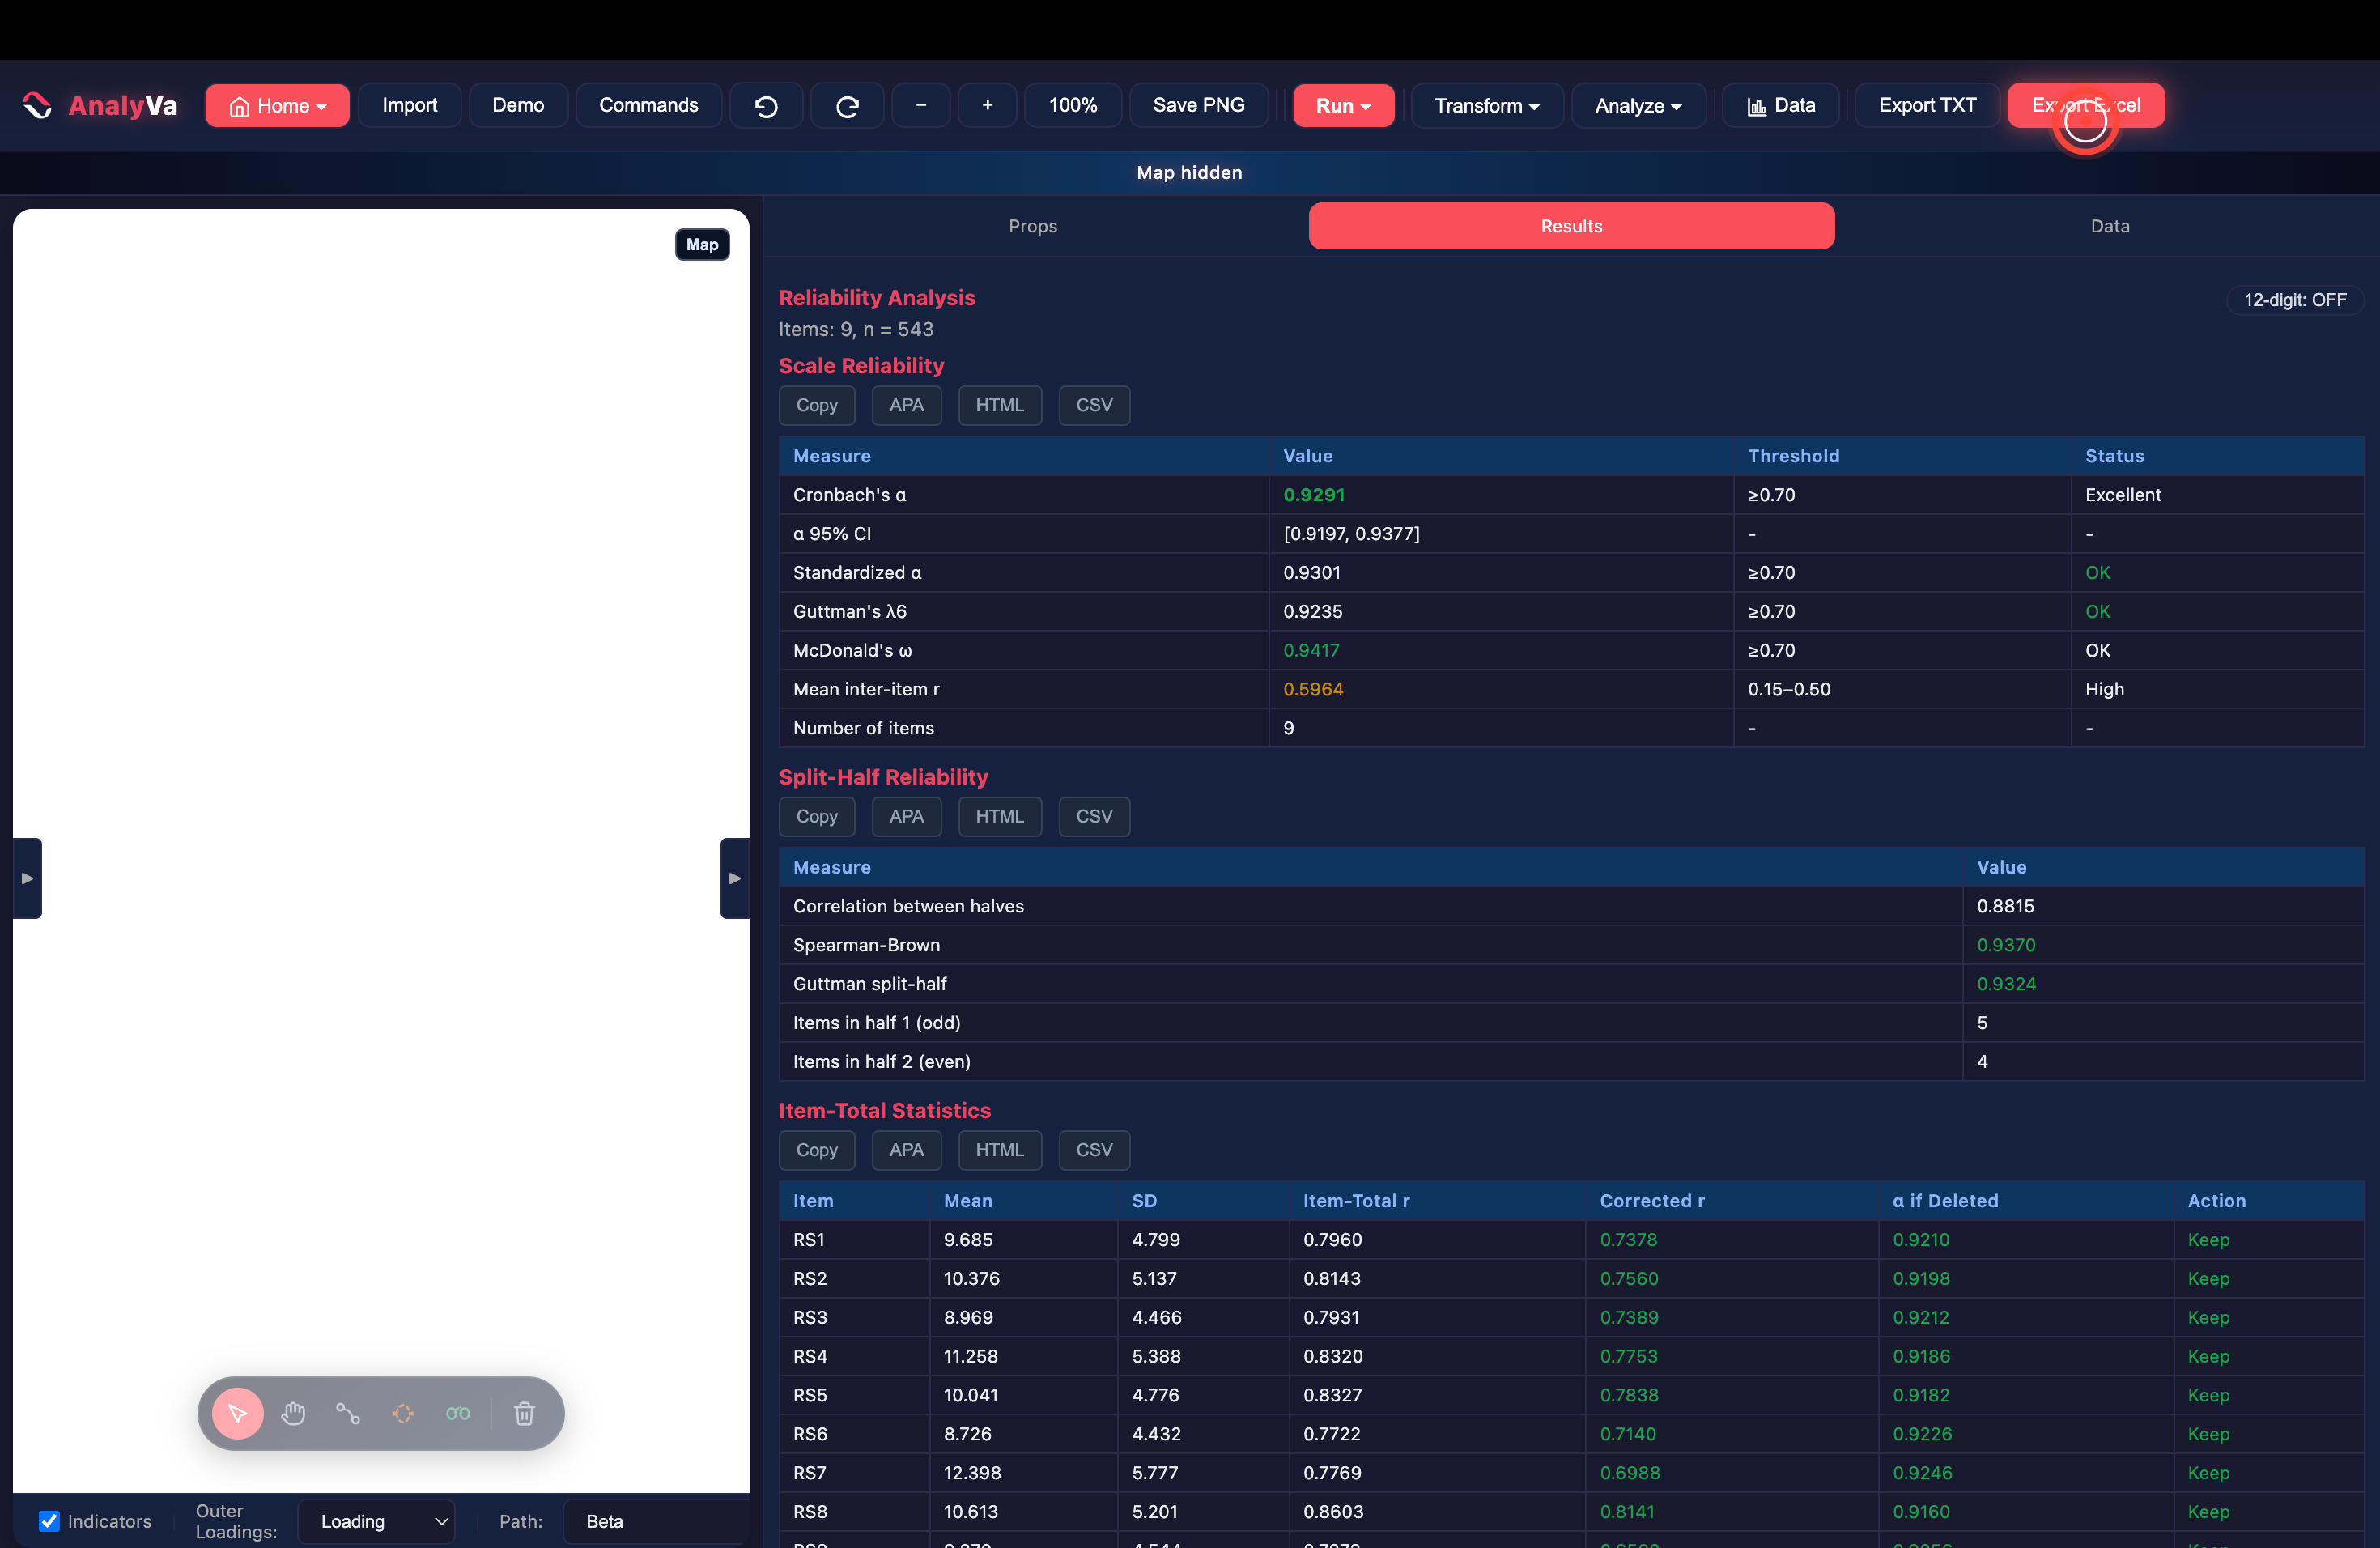
Every table has its own Copy, APA, HTML, and CSV button
above it. Or click Export Excel in the top toolbar to save the
entire Results panel as a single .xlsx file — one sheet per table,
formatted and ready to drop into a manuscript appendix.
Further reading
- Cortina, J. M. (1993). What is coefficient alpha? An examination of theory and applications. Journal of Applied Psychology, 78(1), 98–104.
- Sijtsma, K. (2009). On the use, the misuse, and the very limited usefulness of Cronbach’s alpha. Psychometrika, 74(1), 107–120.