Most people never open the command palette. That is a mistake — it is the single fastest way to work in AnalyVa. Every command in the app — including the ones buried three menus deep — is one keystroke away inside it.
Opening the palette
Press ⌘ + K (macOS) or Ctrl + K (Windows/Linux) from anywhere
in the app. A search bar drops from the top. Type the first few
letters of what you want to do — bootstr, htmt, fit, pca — and
the matching commands filter live. Hit Enter to run the top hit,
or use the arrow keys and then Enter.
Close the palette by pressing Esc or clicking anywhere outside it.
Three families of commands
Every command in the palette shows its category underneath the name (Workspace, Analysis, Panels, Canvas). Once you know the categories, guessing what to type becomes easier.
1. Workspace — data in, files out
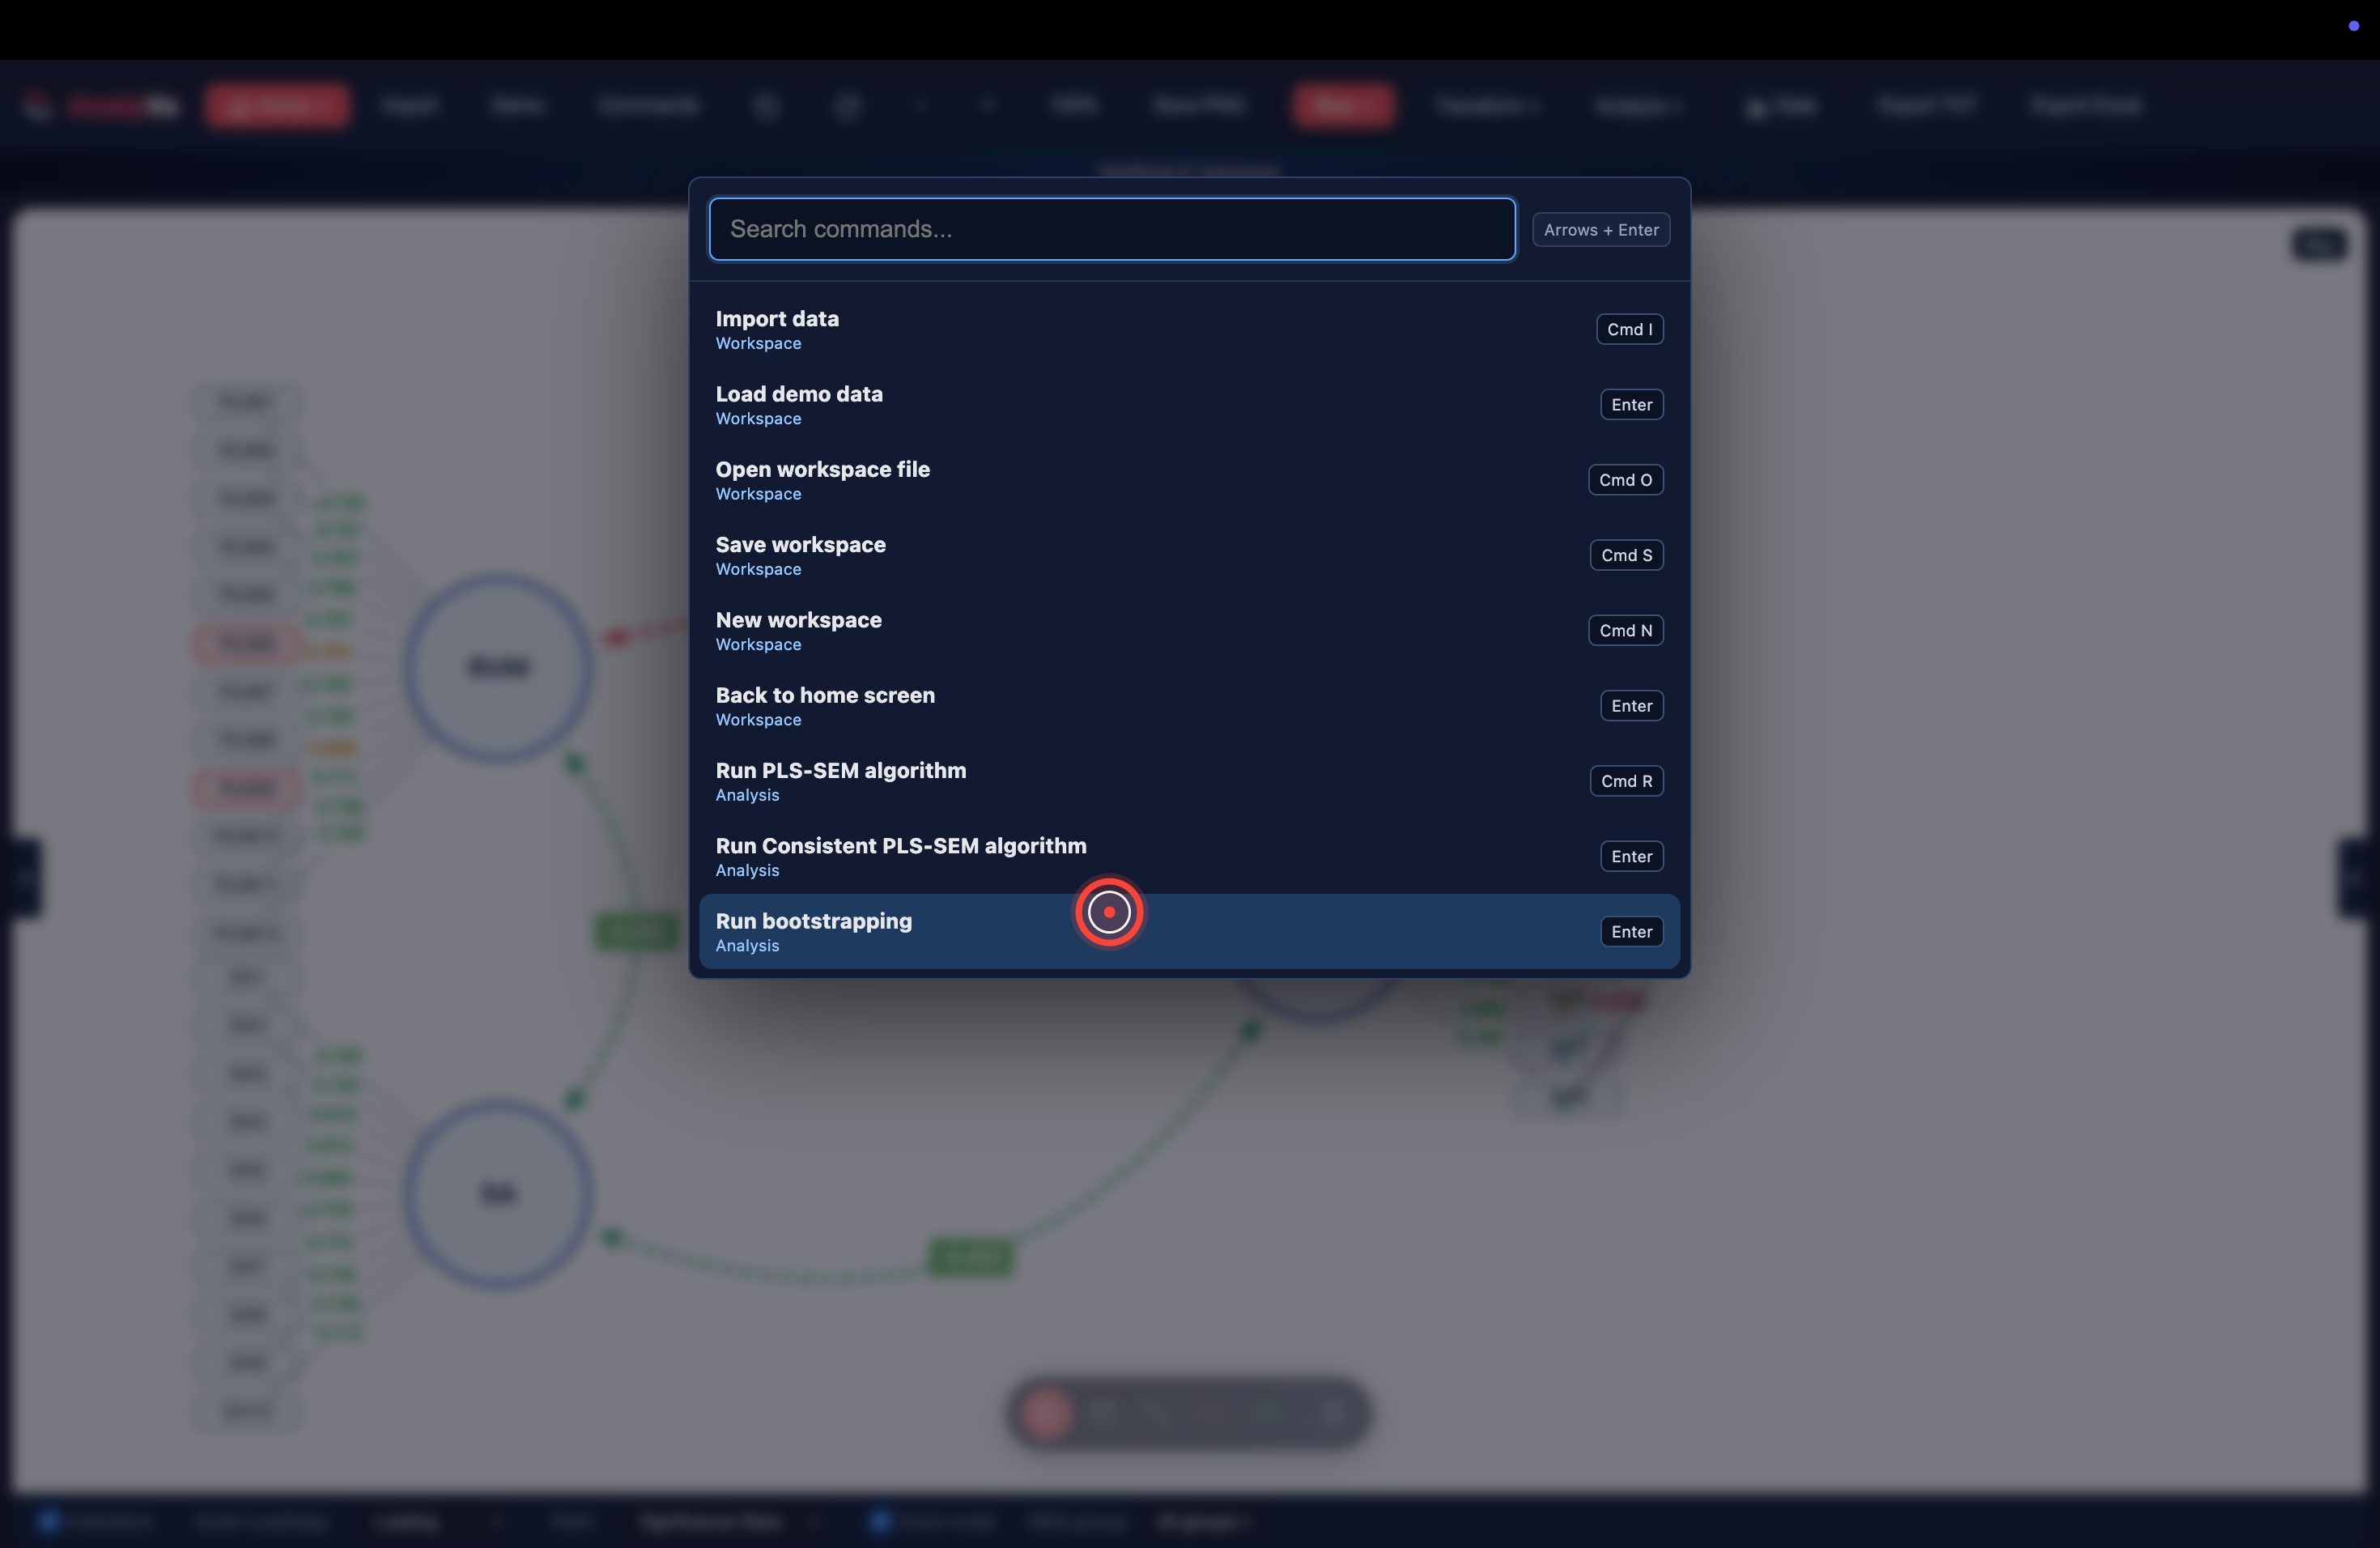
The top of the palette is your data plumbing. Highlights:
- Import data —
⌘ I— the single most common shortcut. Opens the import dialog. Use it every time you switch datasets. - Load demo data — for practice. AnalyVa ships with real research datasets so you can rehearse before running your own.
- Open workspace file / Save workspace —
⌘ O/⌘ S— save and reopen a full model + data + settings state. - New workspace —
⌘ N— start over cleanly. - Back to home screen — takes you to the SEM & Statistics vs Textual Analysis picker.
2. Analysis — run the algorithm you actually need
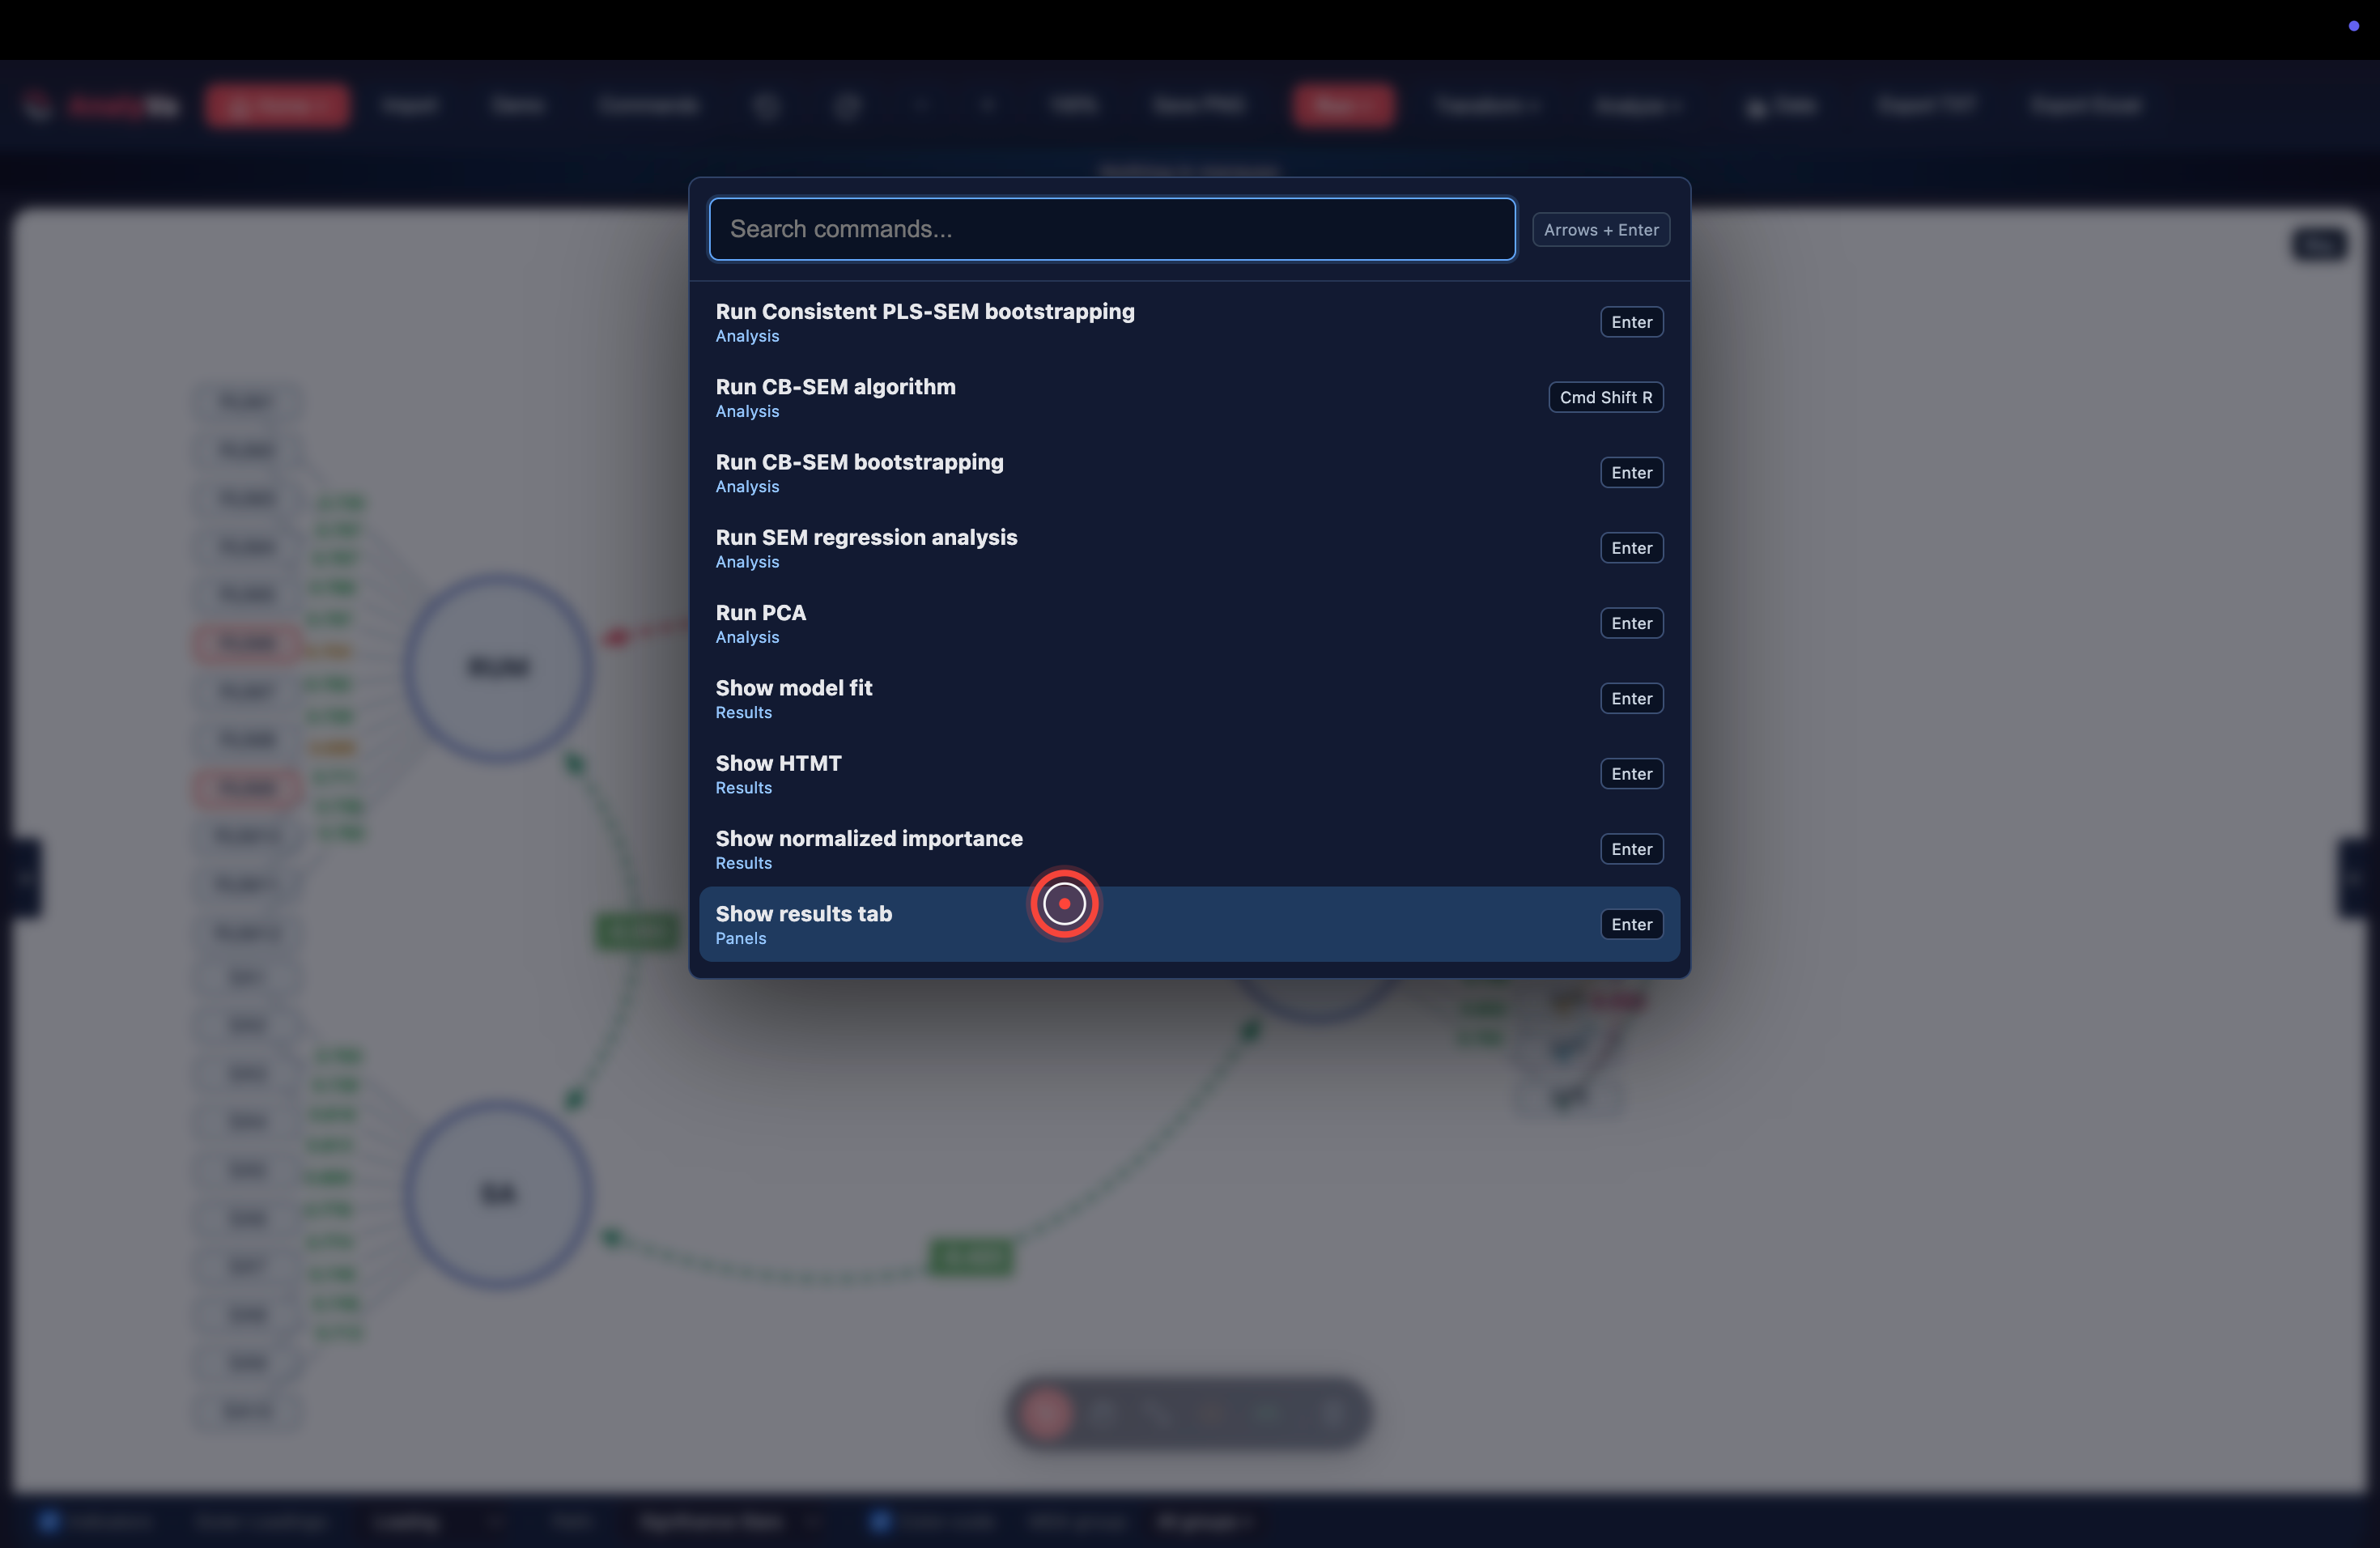
The heart of AnalyVa. Every analytical routine is here — including several that require multi-step menu navigation via the top bar:
- Run PLS-SEM algorithm —
⌘ R— the shortcut you will use the most in SEM work. - Run Consistent PLS-SEM algorithm — the disattenuated variant.
- Run bootstrapping — for path significance, HTMT CI, and effect size CIs.
- Run CB-SEM algorithm —
⌘ Shift R— for covariance-based SEM. - Run CB-SEM bootstrapping — bootstrap version of CB-SEM.
- Run SEM regression analysis — for regression-style output.
- Run PCA — principal component analysis.
There are also result-viewing commands under the Results category:
- Show model fit — jumps to the fit indices section of the Results panel.
- Show HTMT — jumps to the HTMT table.
- Show normalized importance — jumps to IPMA results.
If you already ran an analysis, use these to navigate its output without scrolling.
3. Canvas & panels — move around the model
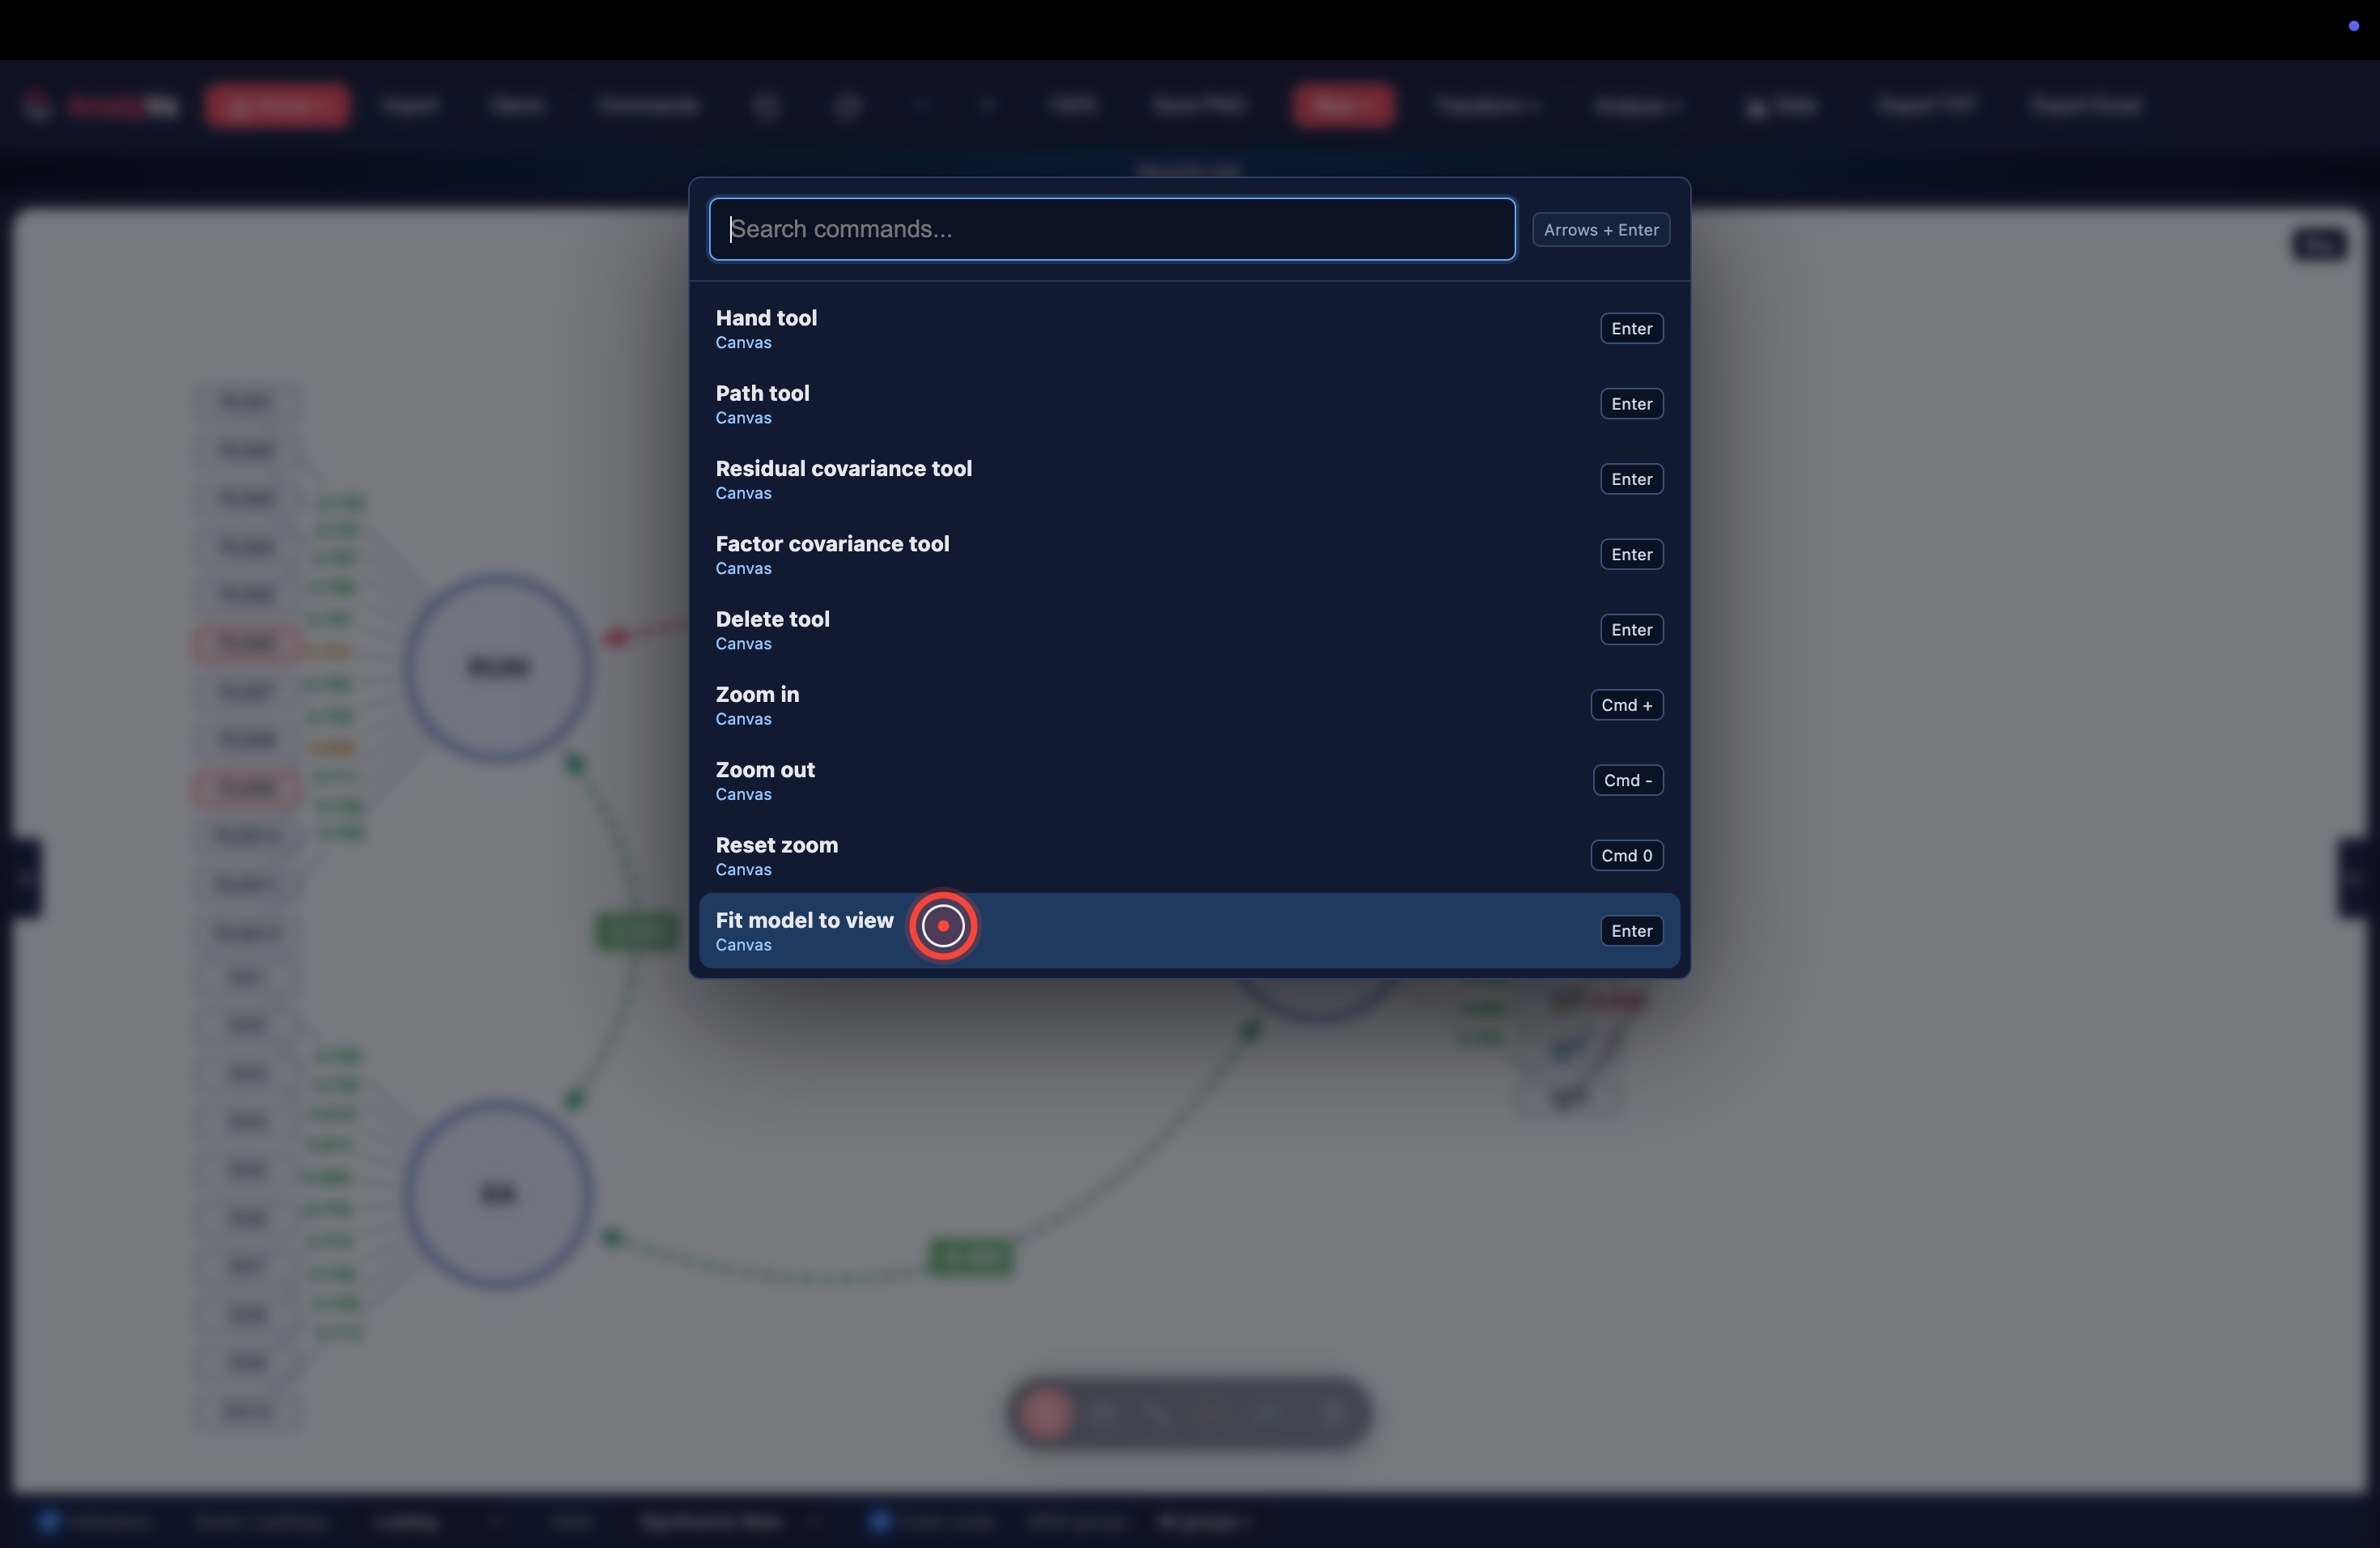
The bottom of the palette is spatial: tools that manipulate what you see on the canvas.
- Hand tool / Path tool — switch tool modes without going to the bottom floating toolbar.
- Residual covariance tool / Factor covariance tool — draw those two special path types for CB-SEM identification tricks.
- Delete tool — delete constructs, indicators, or paths.
- Zoom in / Zoom out / Reset zoom —
⌘ +/⌘ -/⌘ 0. Same conventions as your browser. - Fit model to view — the single most useful spatial command. If your model has drifted off-screen or you are lost in a big canvas, this button reframes everything to fit. Add it to muscle memory.
The productivity pattern
The palette is faster than menus for four specific reasons:
- It is search-first, not location-first. You do not have to remember which menu contains which command.
- Every command lives there — including ones that appear only inside submenus of submenus.
- The keyboard shortcuts are printed on the right of each row, so the palette doubles as a discovery mechanism for the shortcuts themselves.
- The order is stable. Recently-used commands do not shuffle to the top, so you build muscle memory for the exact position of your most-used commands.
The five shortcuts to memorise this week
If you only remember five, remember these — they cover roughly 80% of routine AnalyVa work:
| Shortcut | Action |
|---|---|
⌘ K |
Open the command palette |
⌘ I |
Import data |
⌘ R |
Run PLS-SEM algorithm |
⌘ 0 |
Reset zoom / Fit model to view |
⌘ S |
Save workspace |
Do the reps for a week and you will stop reaching for the top menu bar almost entirely.