Moderation is the PLS-SEM technique that gets misread most often: a non-significant interaction term doesn’t mean the moderator doesn’t matter, and a significant one doesn’t automatically mean it’s large. This post picks up the four-construct model from the indicator-cleaning walkthrough, adds a moderator, and runs it through AnalyVa’s full significance pipeline — Beta, p-value, and significance-star display — so the difference between “detected” and “meaningful” stays visible the whole way through.
Adding the moderator construct
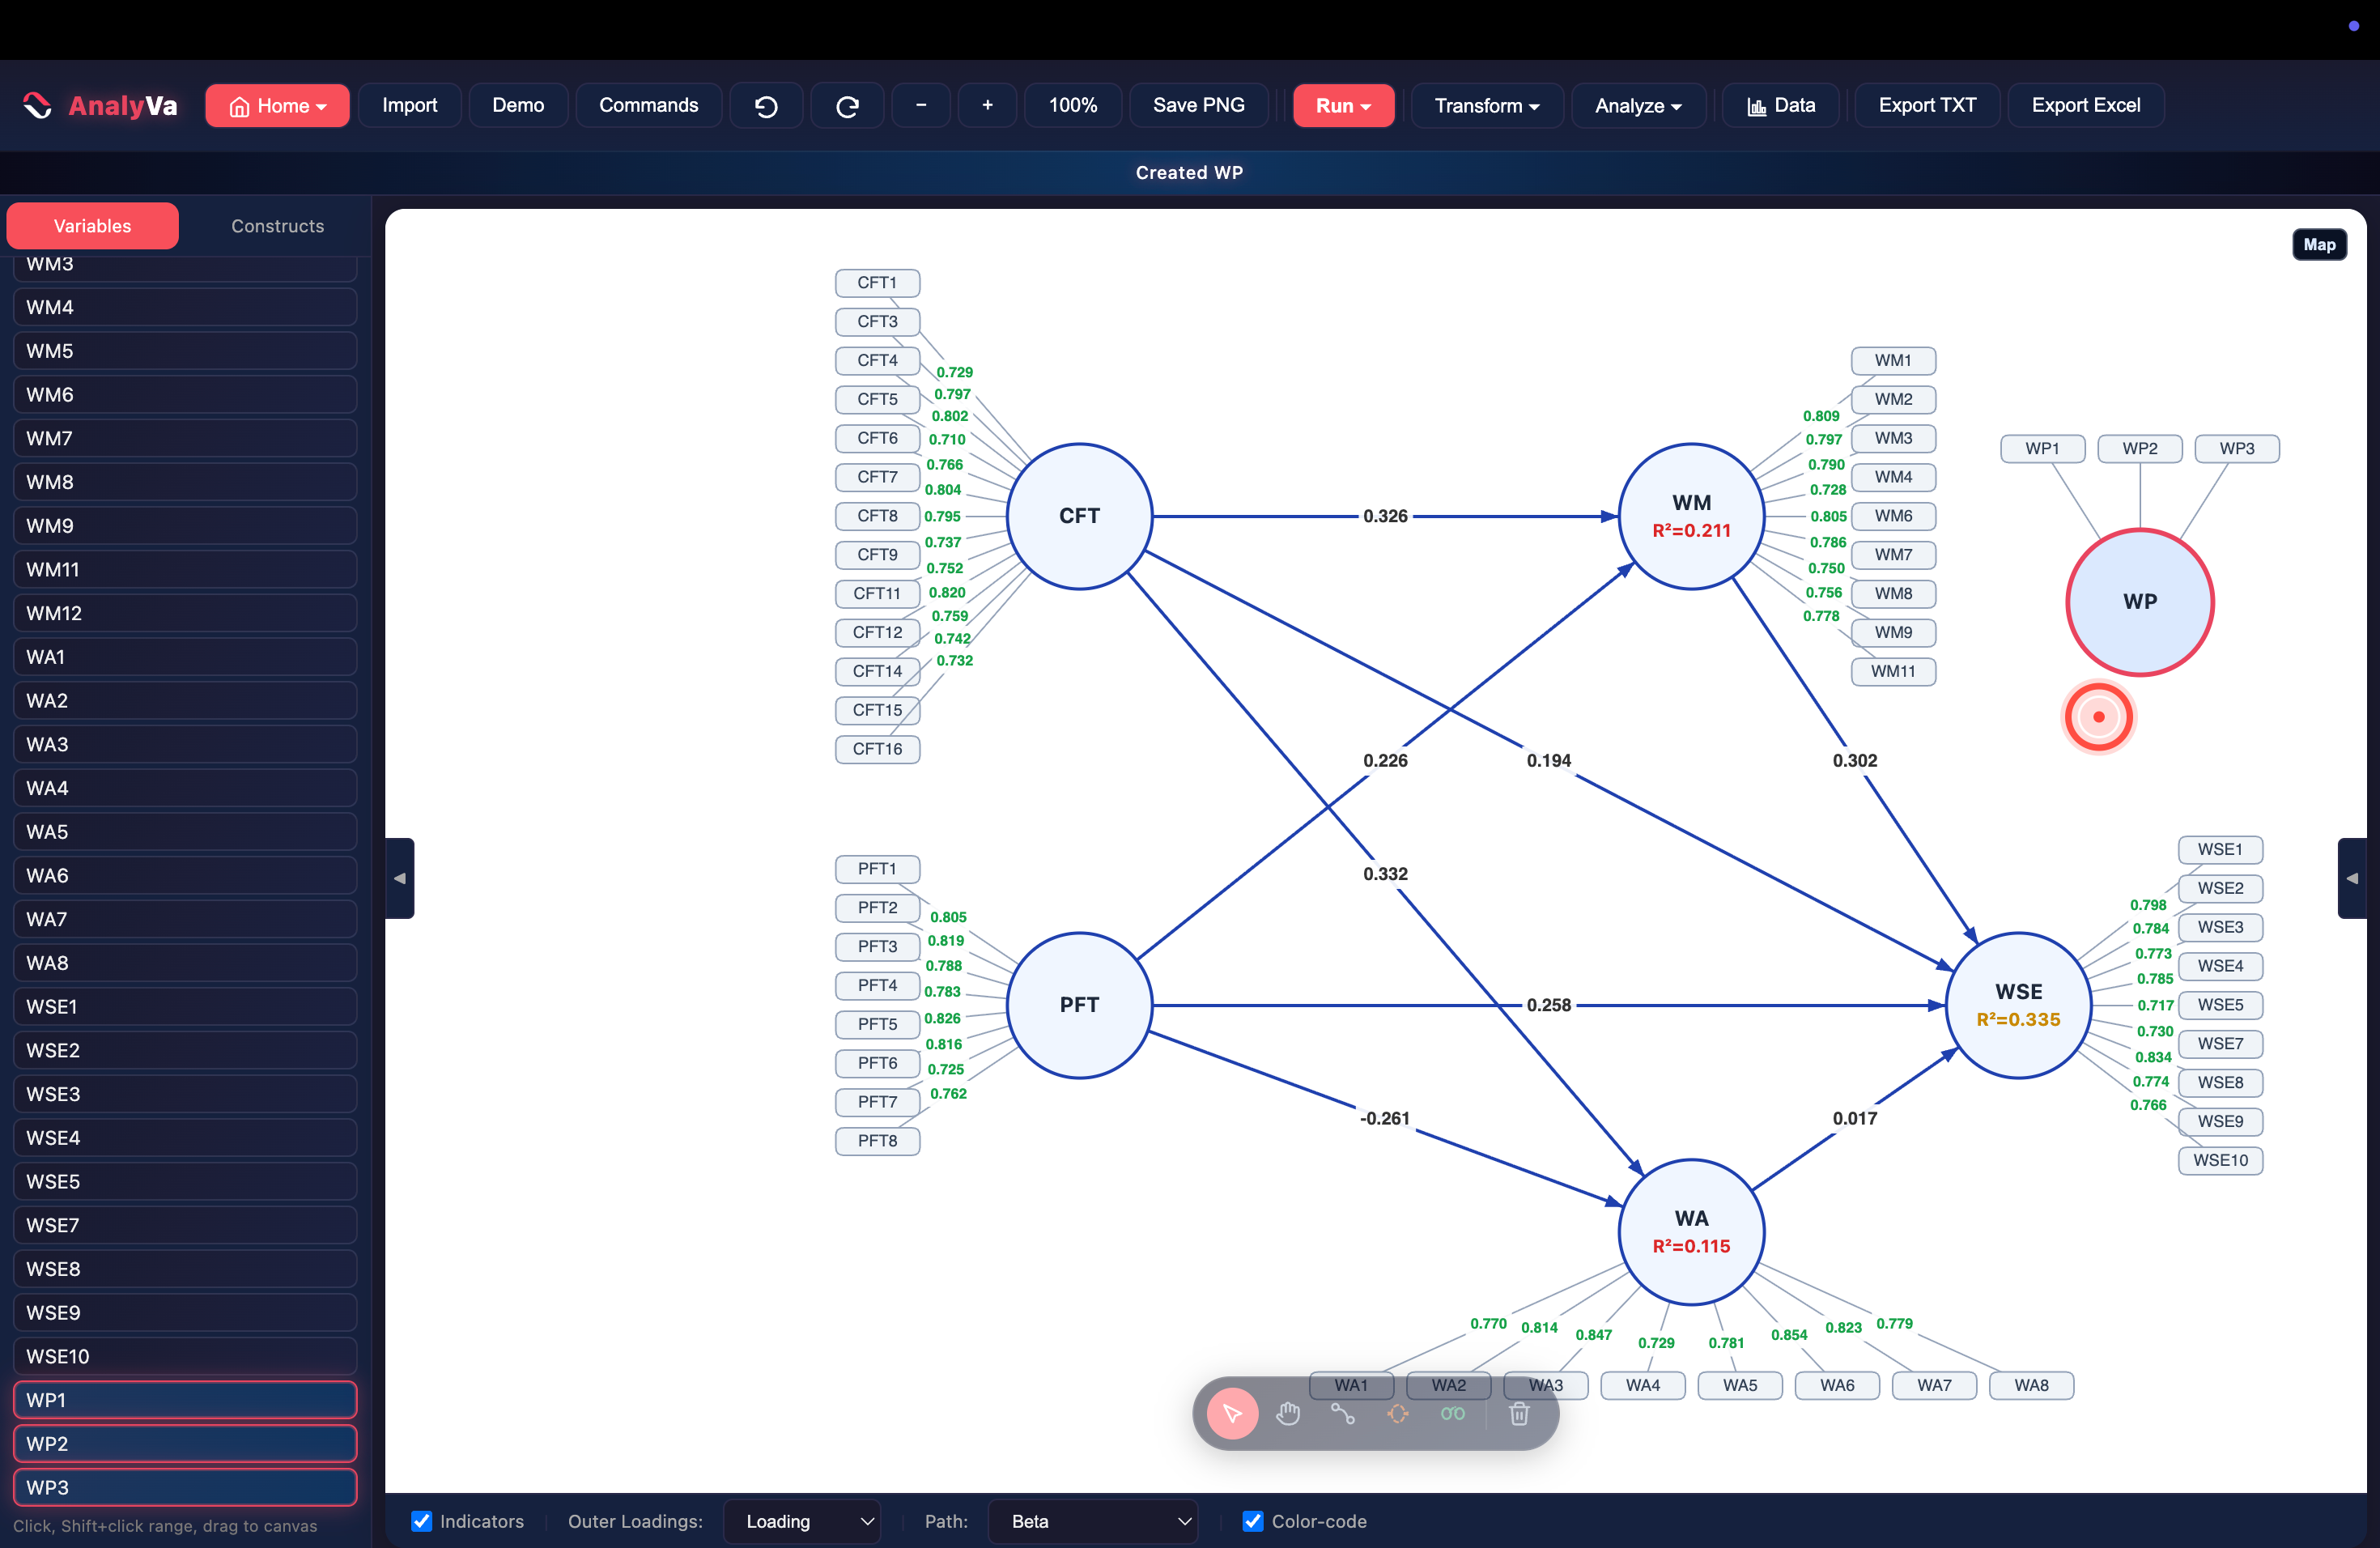
Step 1 — Build the WP construct from its indicators.
Select WP1–WP3 in the sidebar the same way any other construct is
built (click, shift-click, drag to canvas). AnalyVa confirms with
“Created WP” and places it as a standalone construct, not yet
connected to anything.
Drawing the interaction paths
A moderator needs one interaction path per relationship it’s hypothesized to moderate. This model tests four: does WP change the strength of WM → WSE, WA → WSE, PFT → WSE, or CFT → WM?
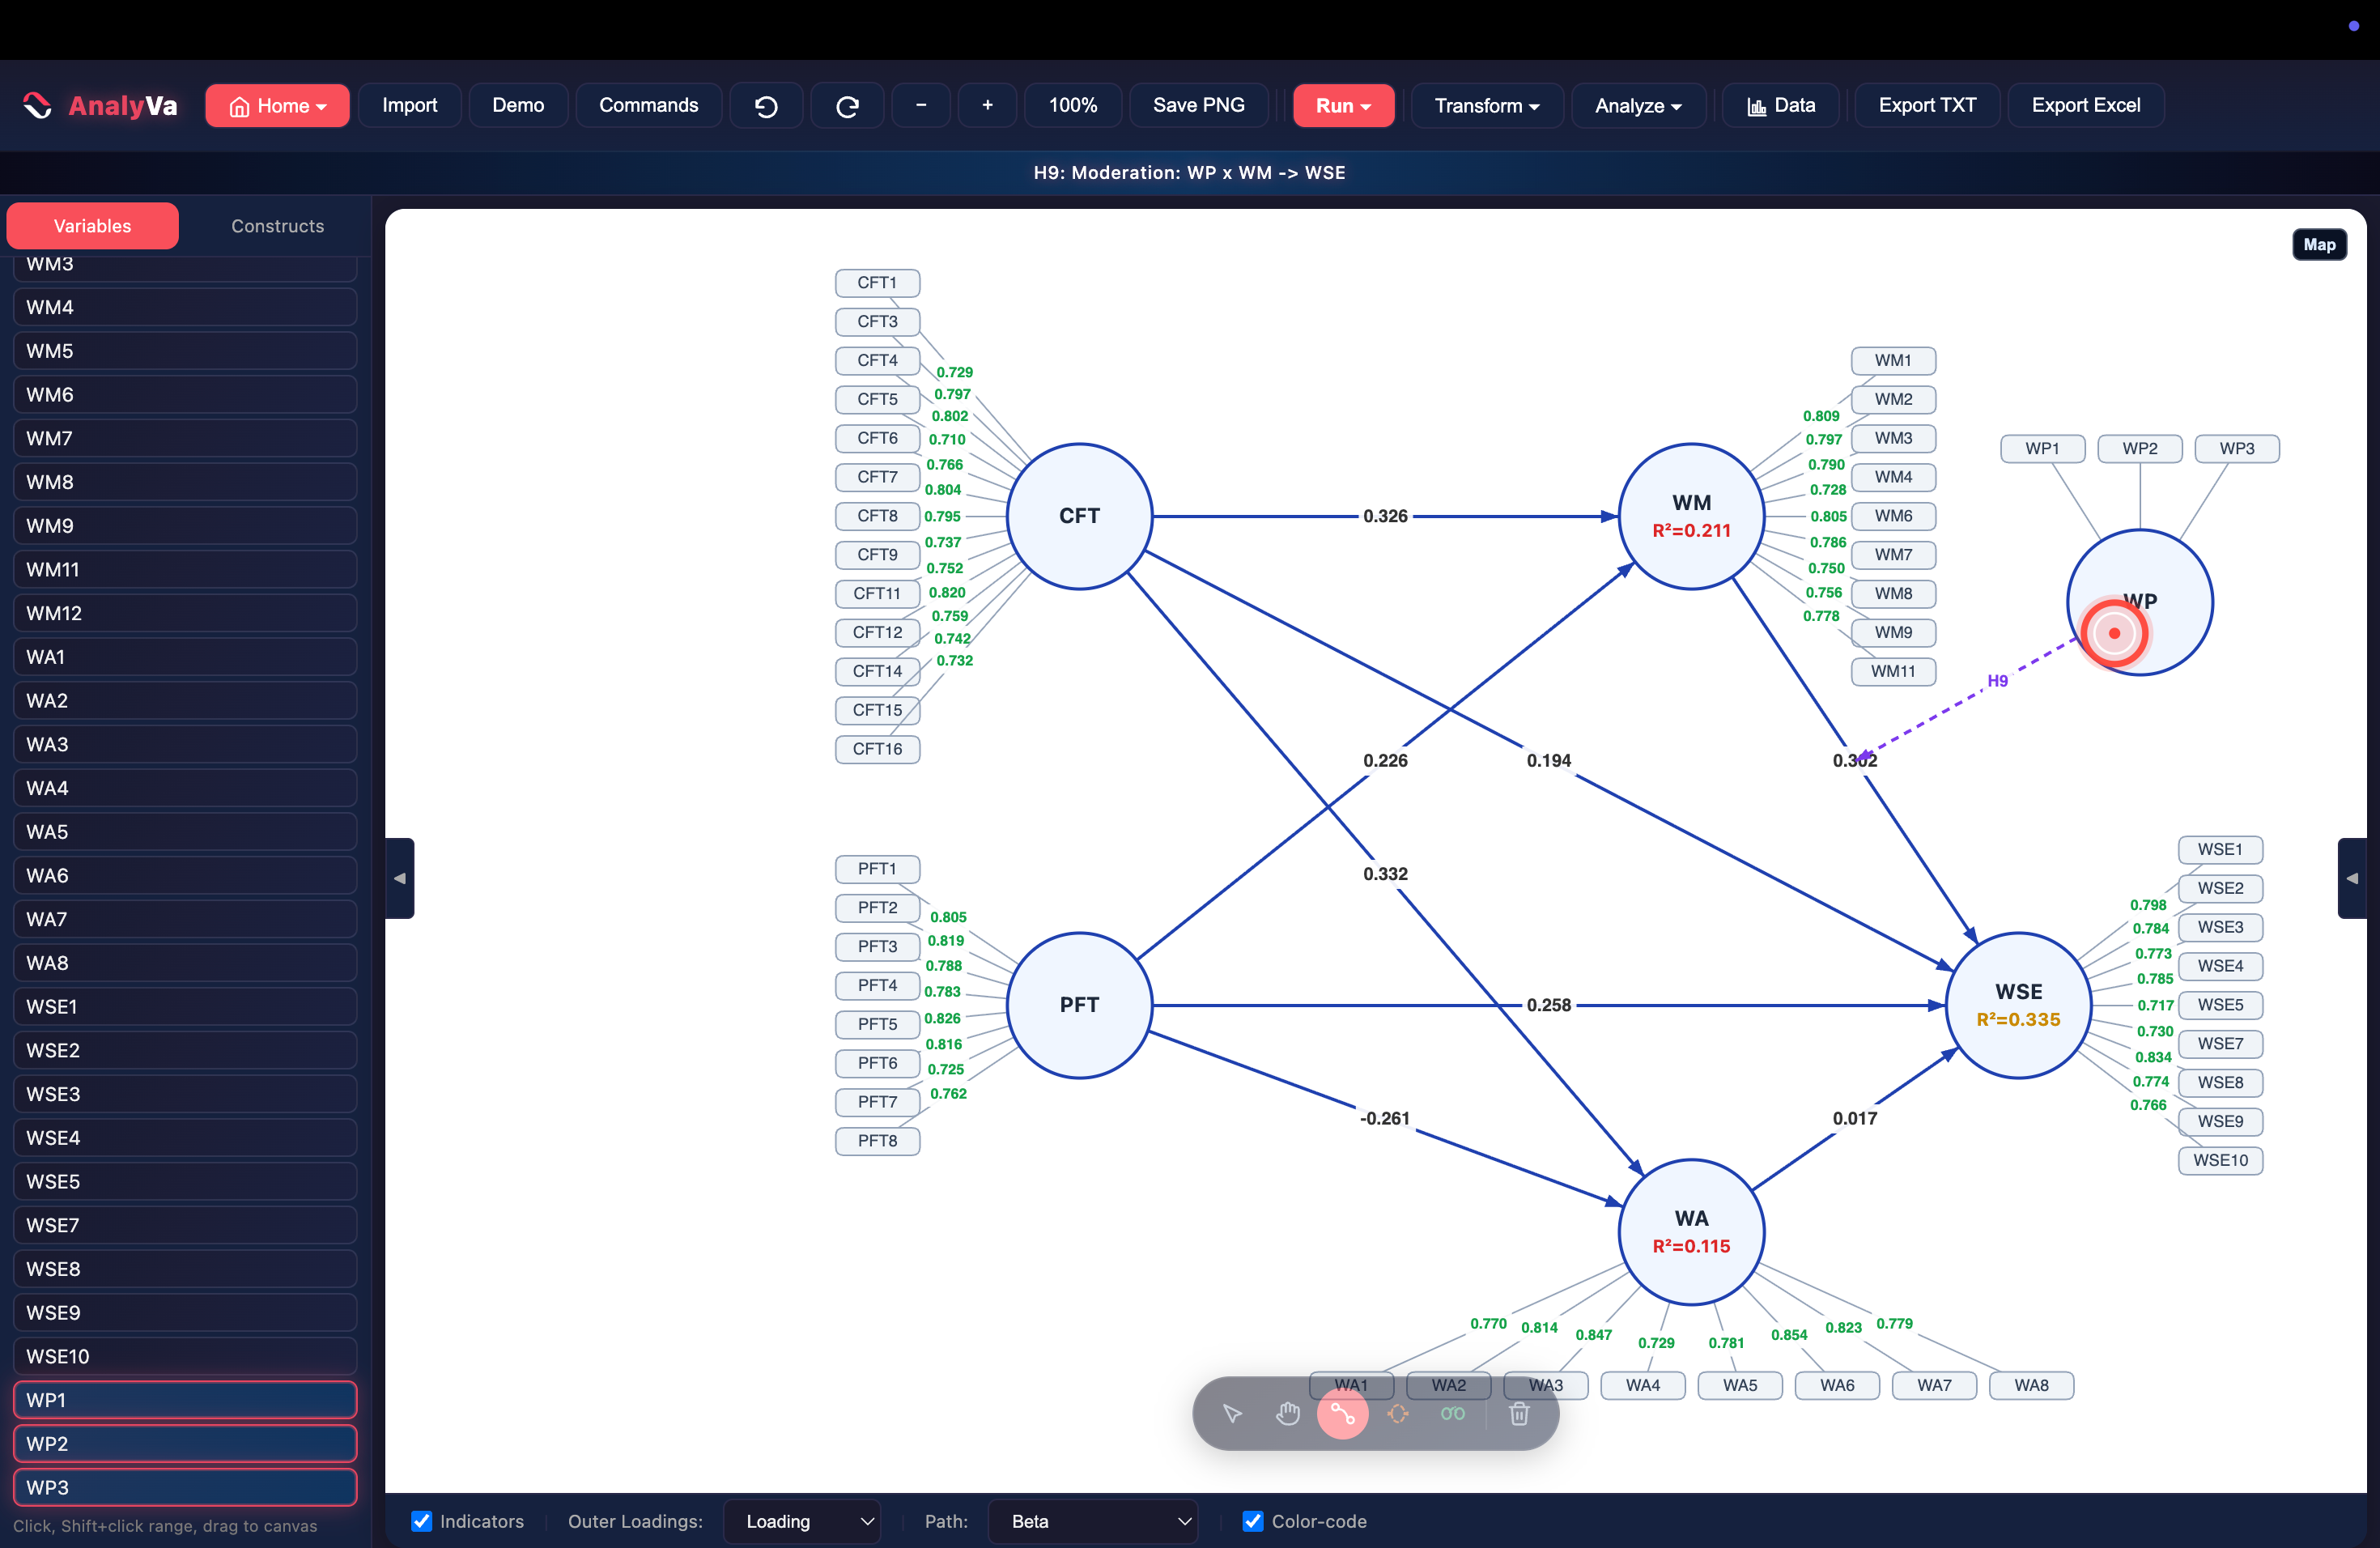
Step 2 — H9: WP × WM → WSE. With the Path tool active, click WP, then click WSE. AnalyVa draws the interaction as a dashed purple line — visually distinct from the solid blue structural paths — and labels it automatically.
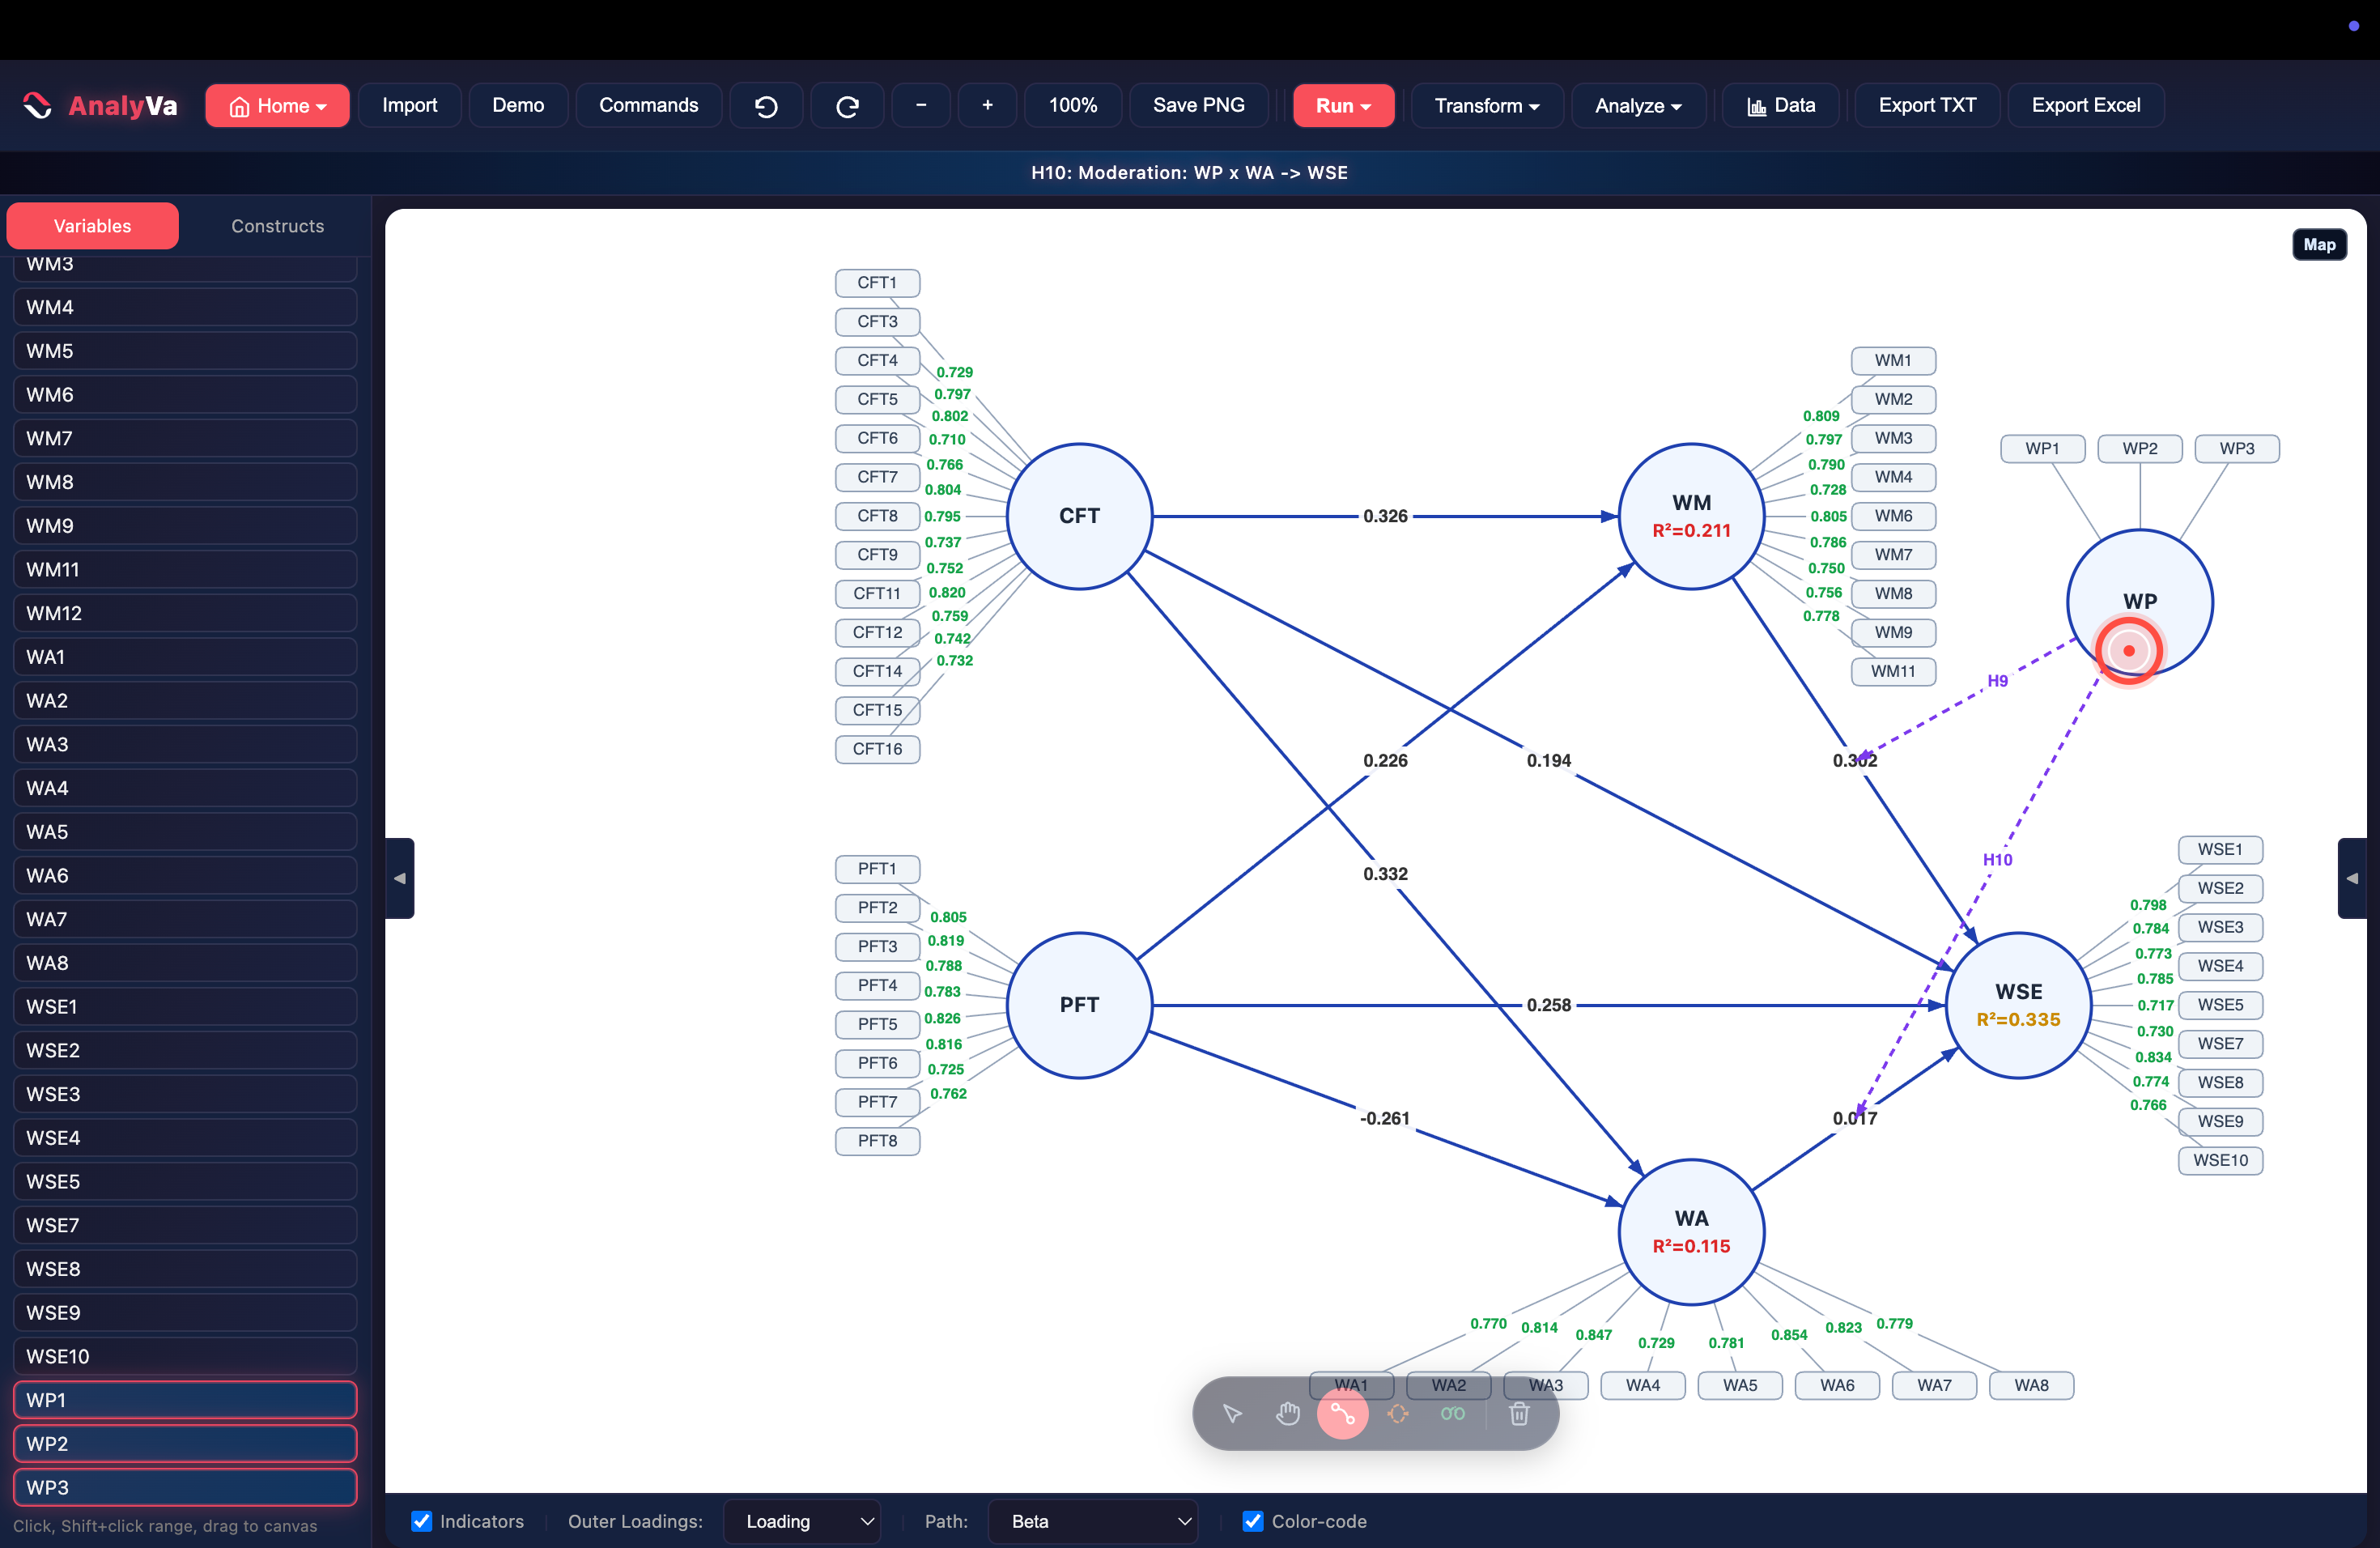
Step 3 — H10: WP × WA → WSE. Same click-click pattern for the second interaction term.
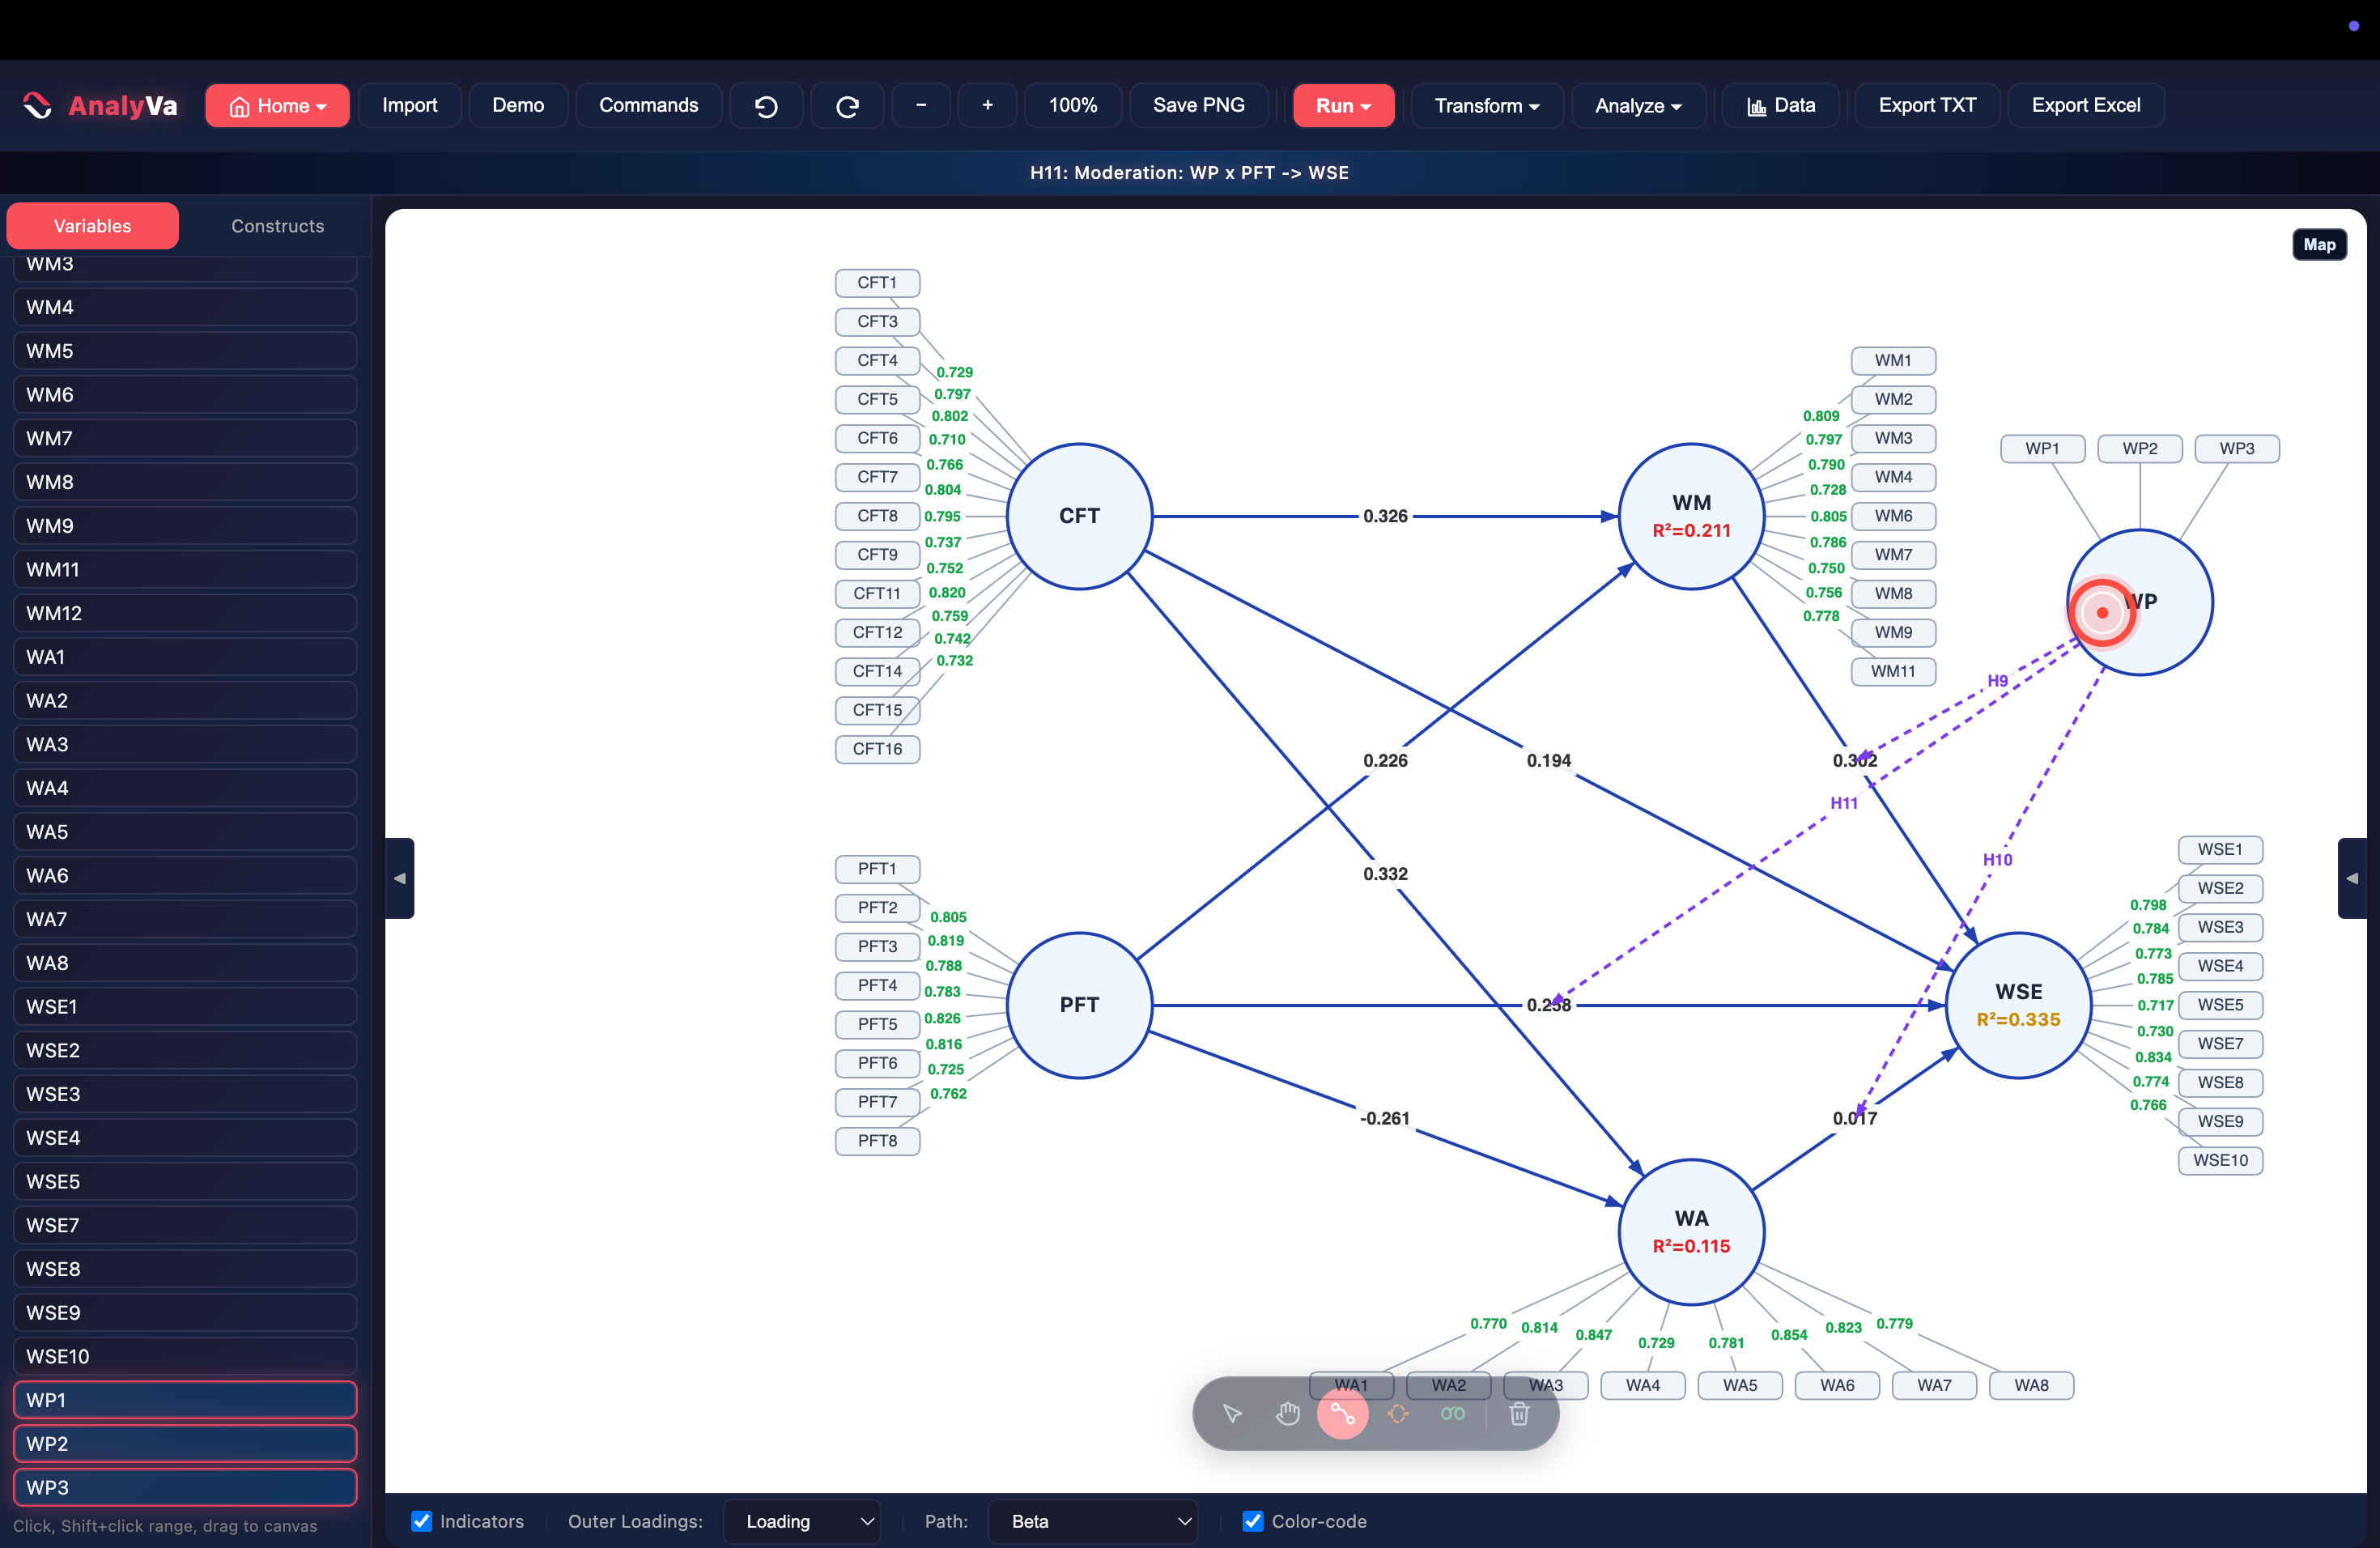
Step 4 — H11: WP × PFT → WSE. A third interaction term, same pattern.
Step 5 — H12: WP × CFT → WM. The fourth interaction targets WM instead of WSE — the moderator doesn’t have to point at the same endogenous construct every time.
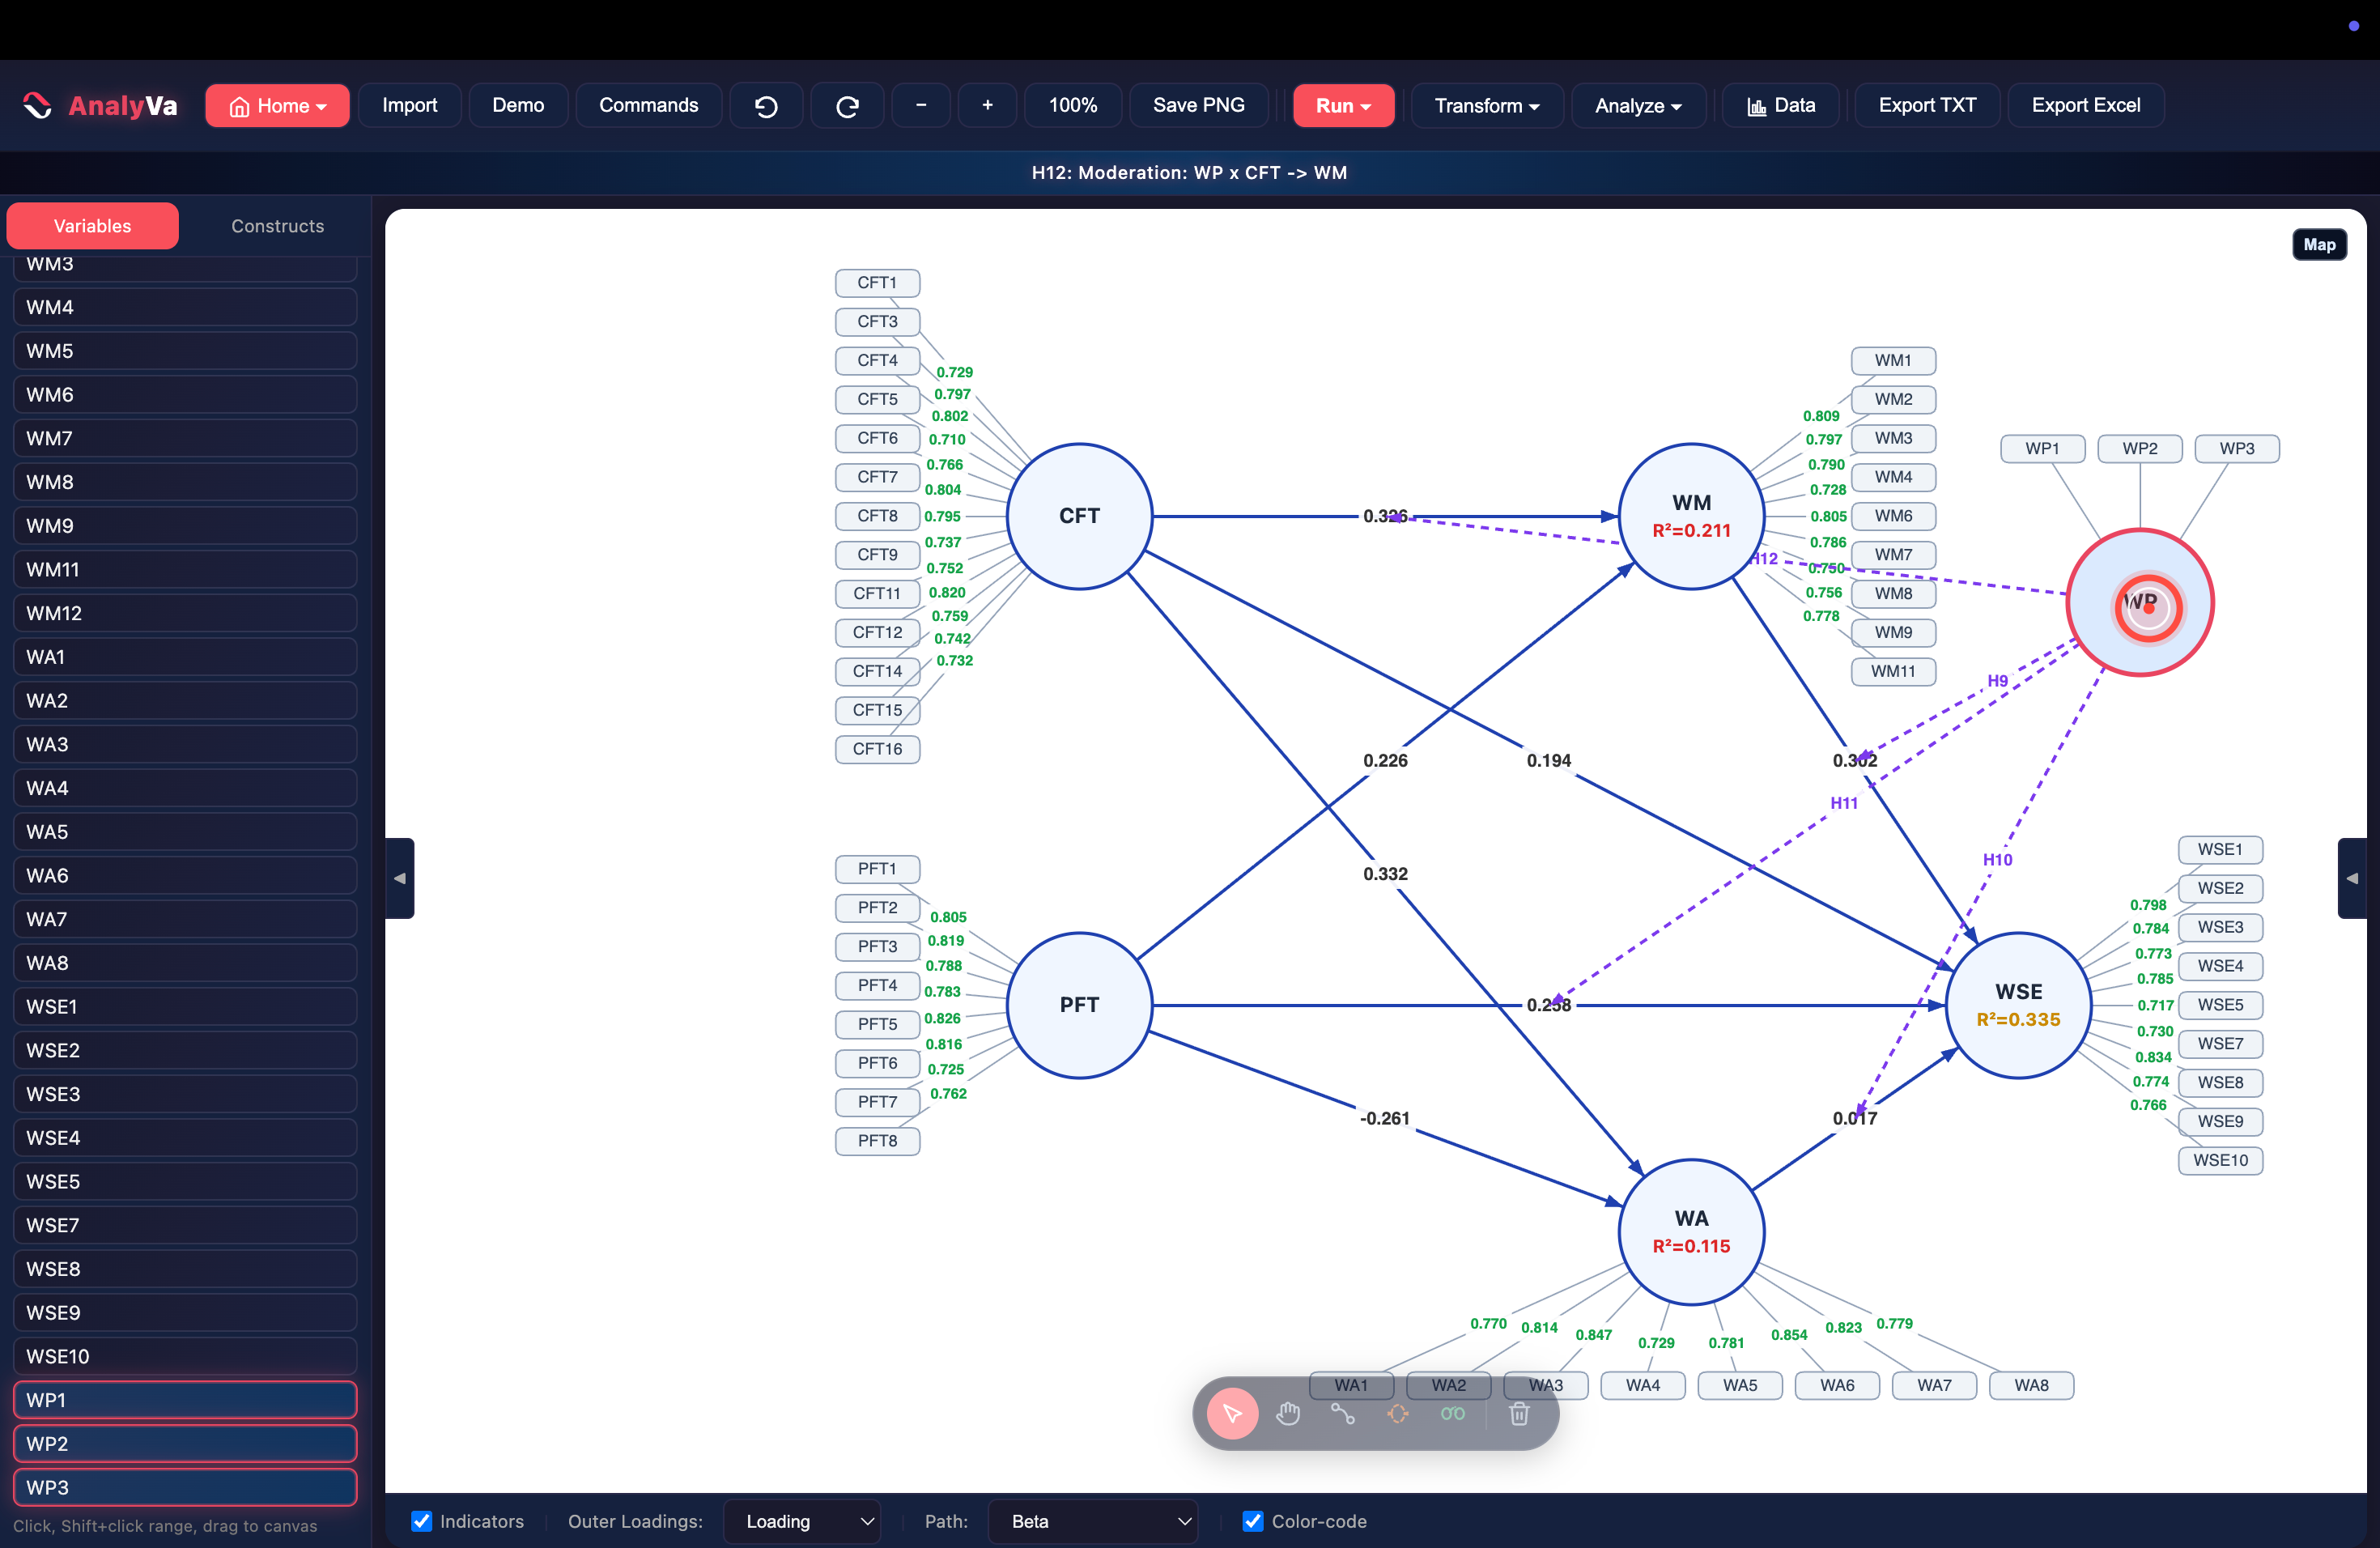
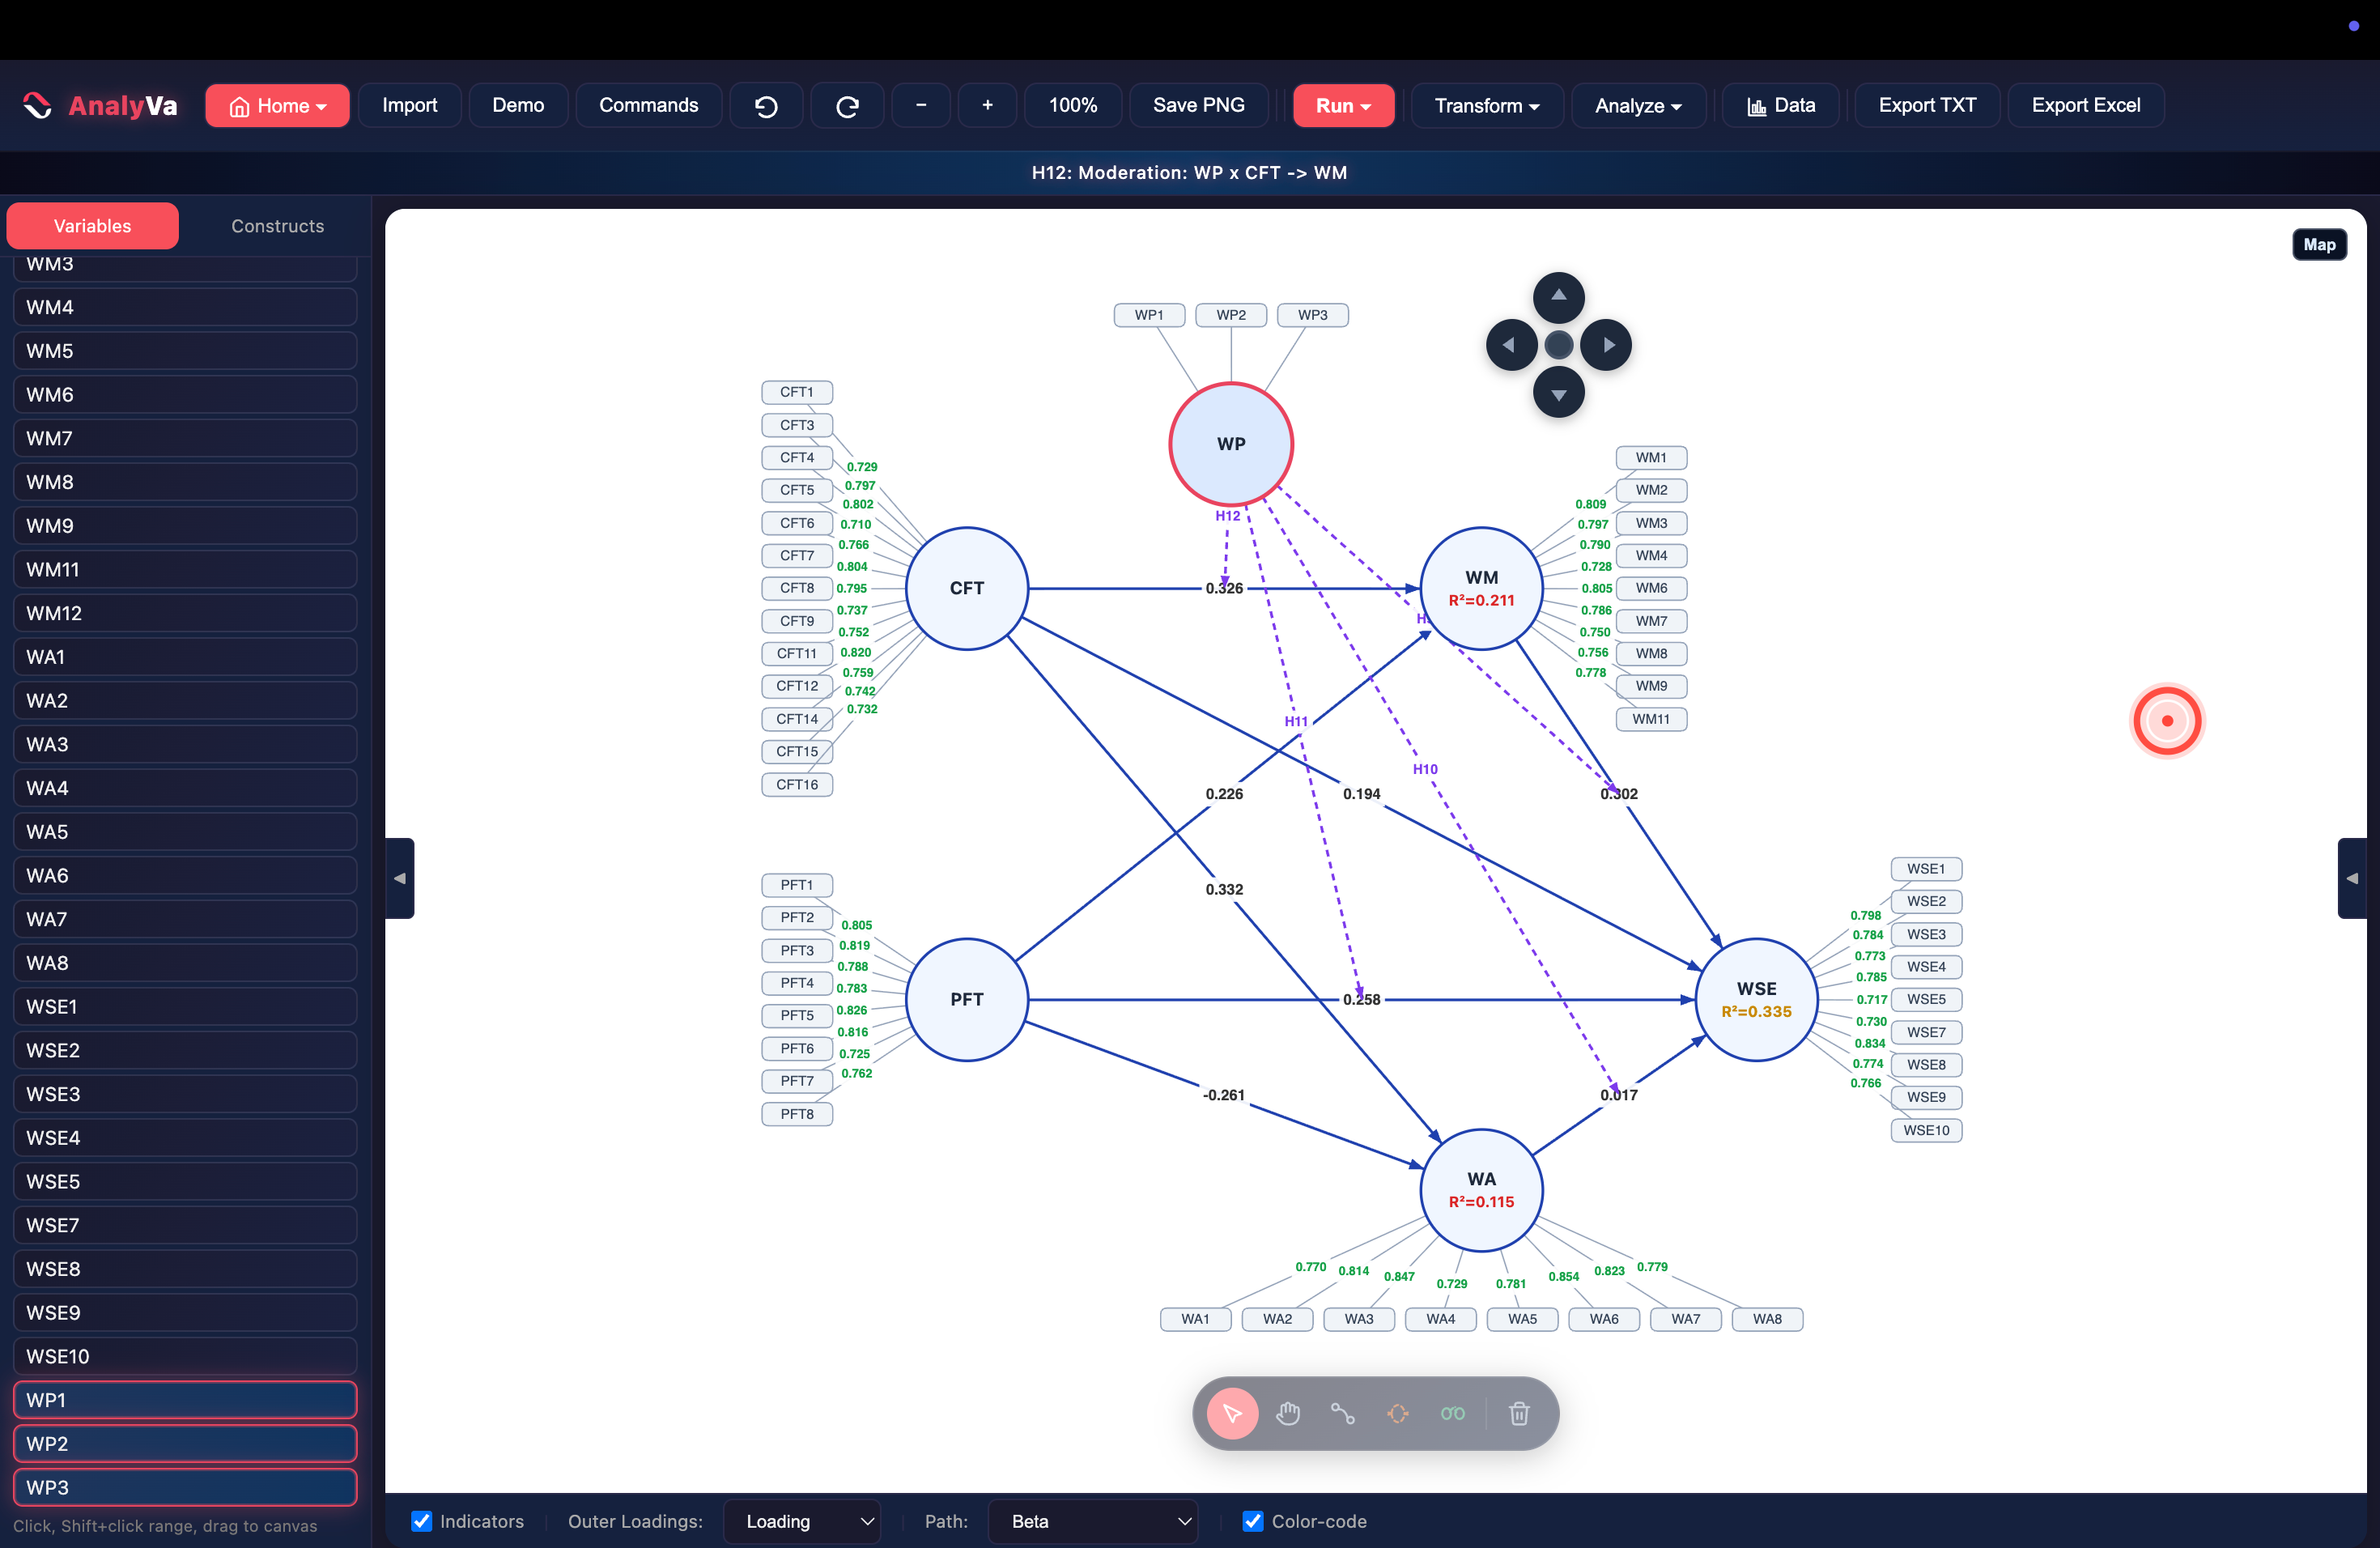
Step 6 — Reposition WP for a readable diagram. With all four interactions drawn, drag WP to a clearer spot (top center, in this case) using the canvas’s arrow controls. All four dashed paths — H9 through H12 — now fan out clearly from WP.
Running the moderated model
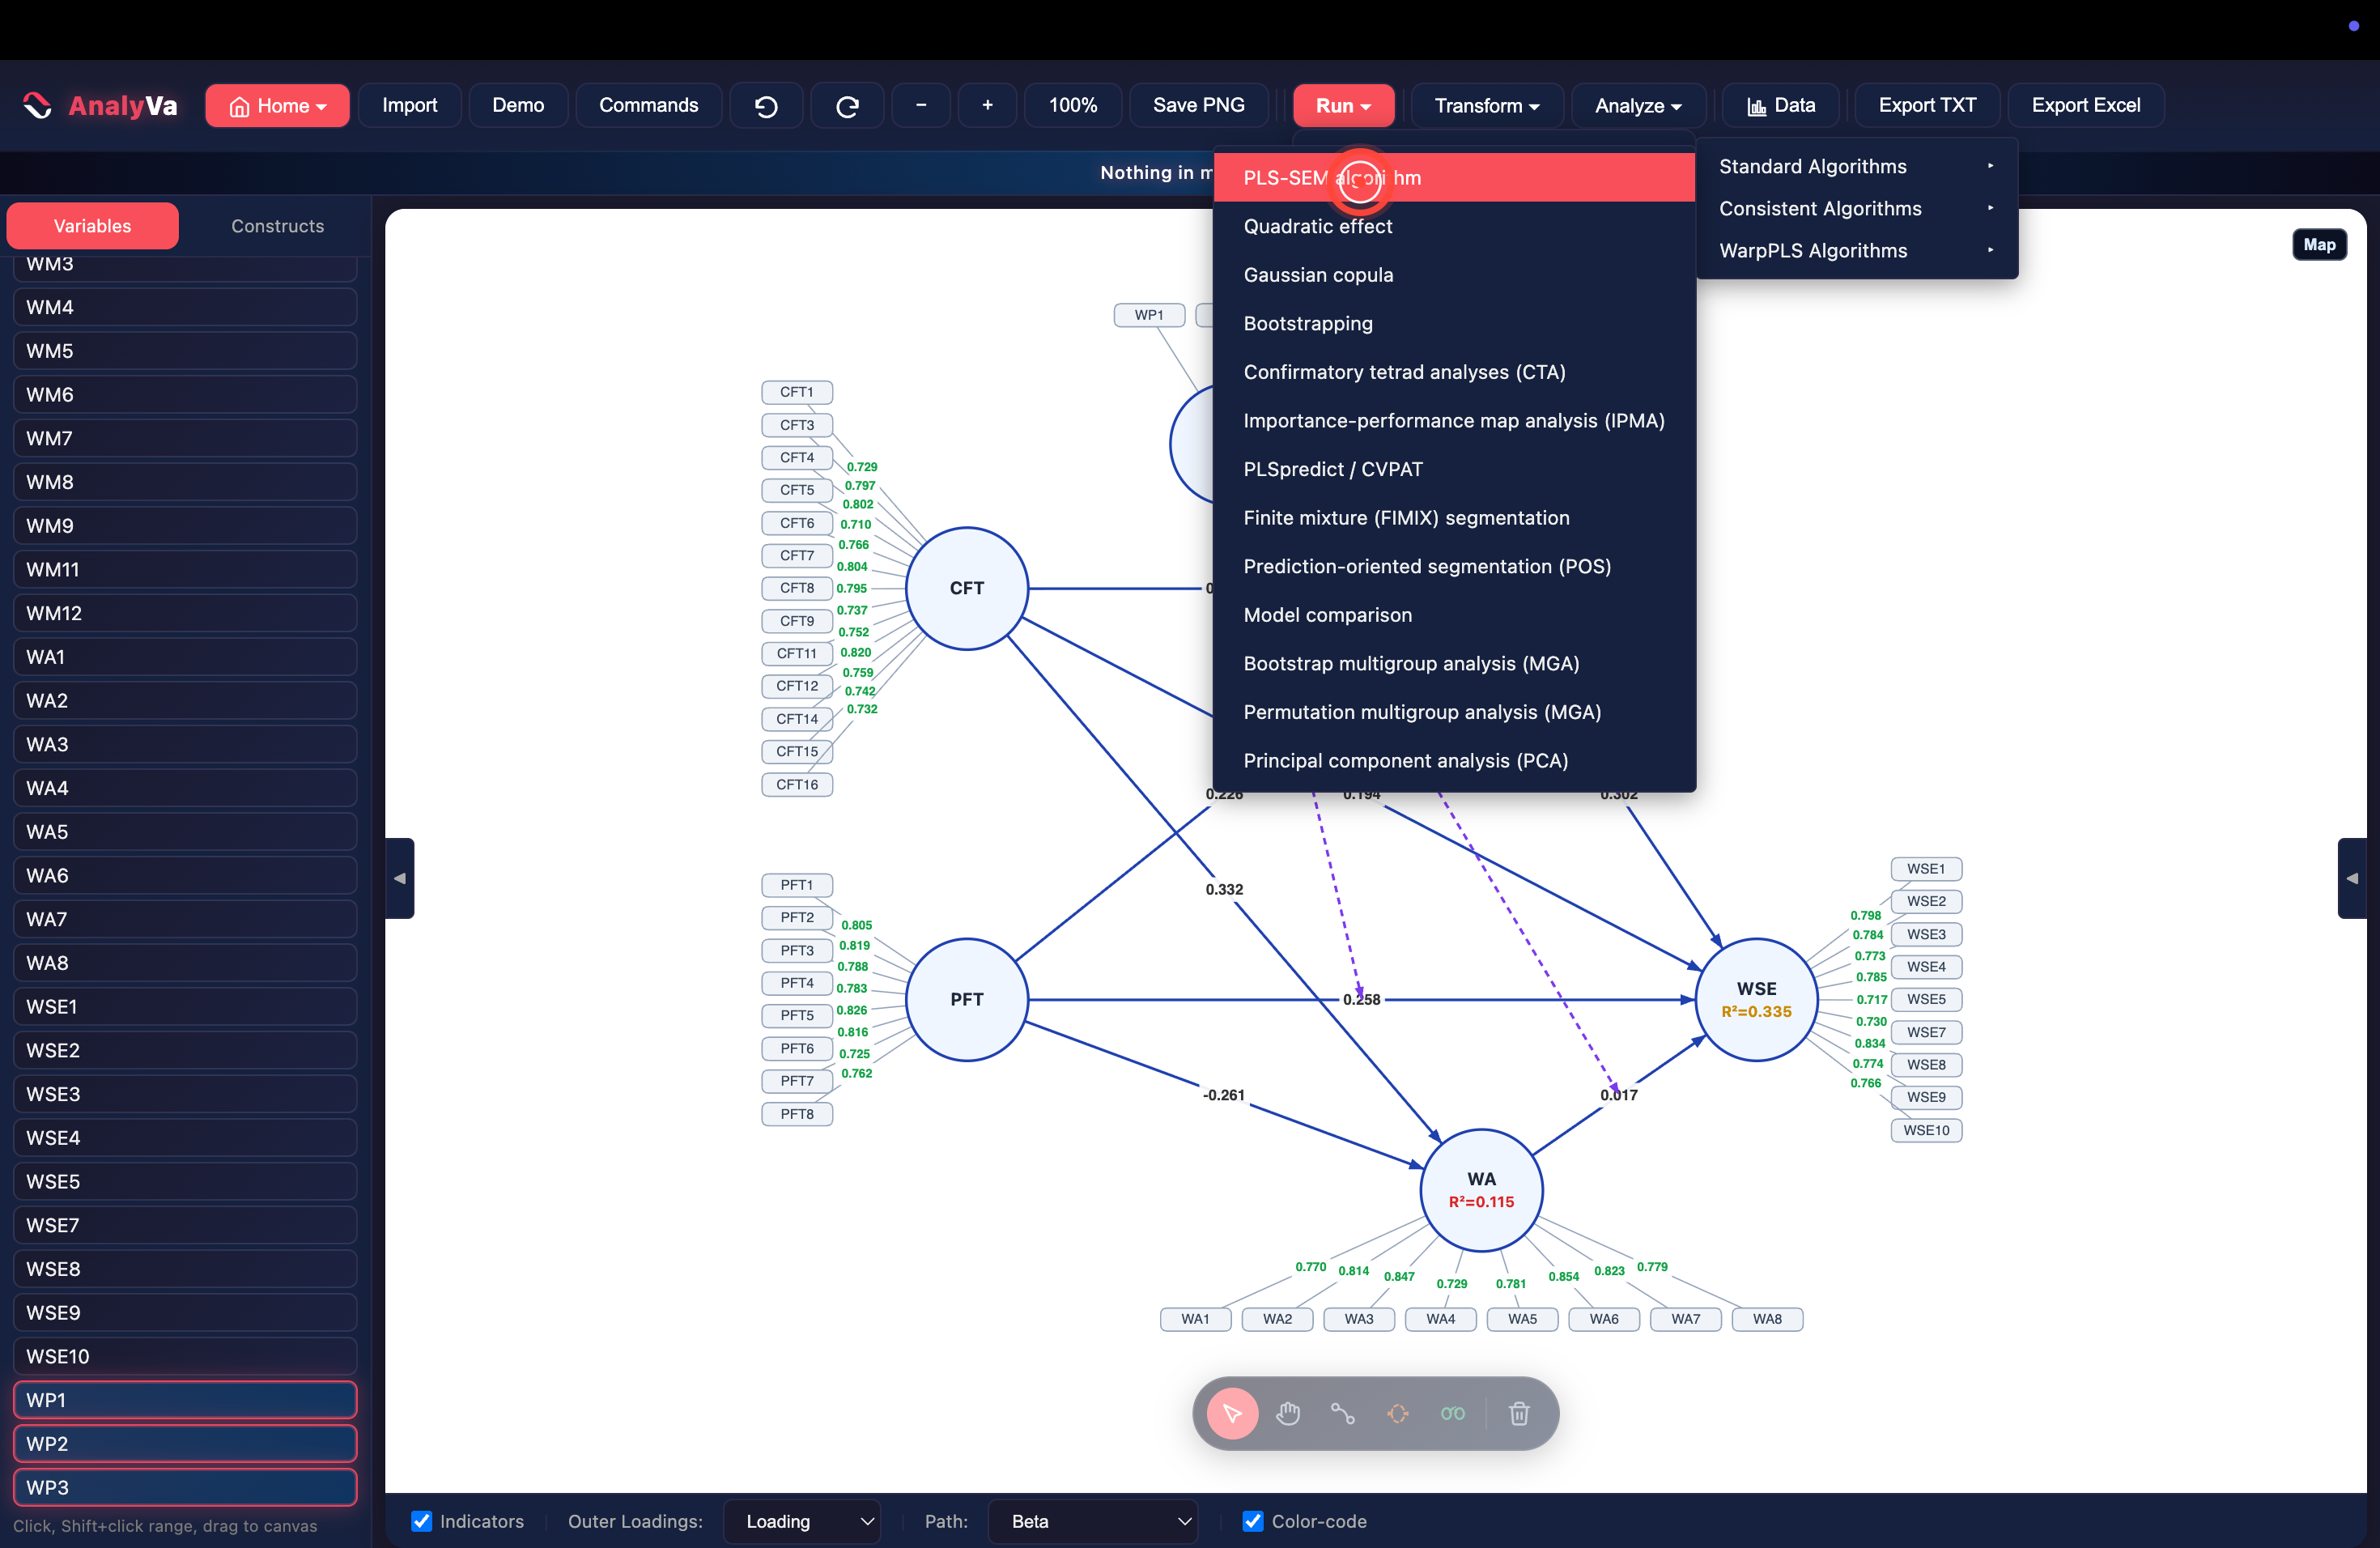
Step 7 — Open Run → PLS-SEM → Standard Algorithms → PLS-SEM algorithm again. The same menu used to run the base model in the earlier post — running it again re-estimates with the four new interaction terms included.
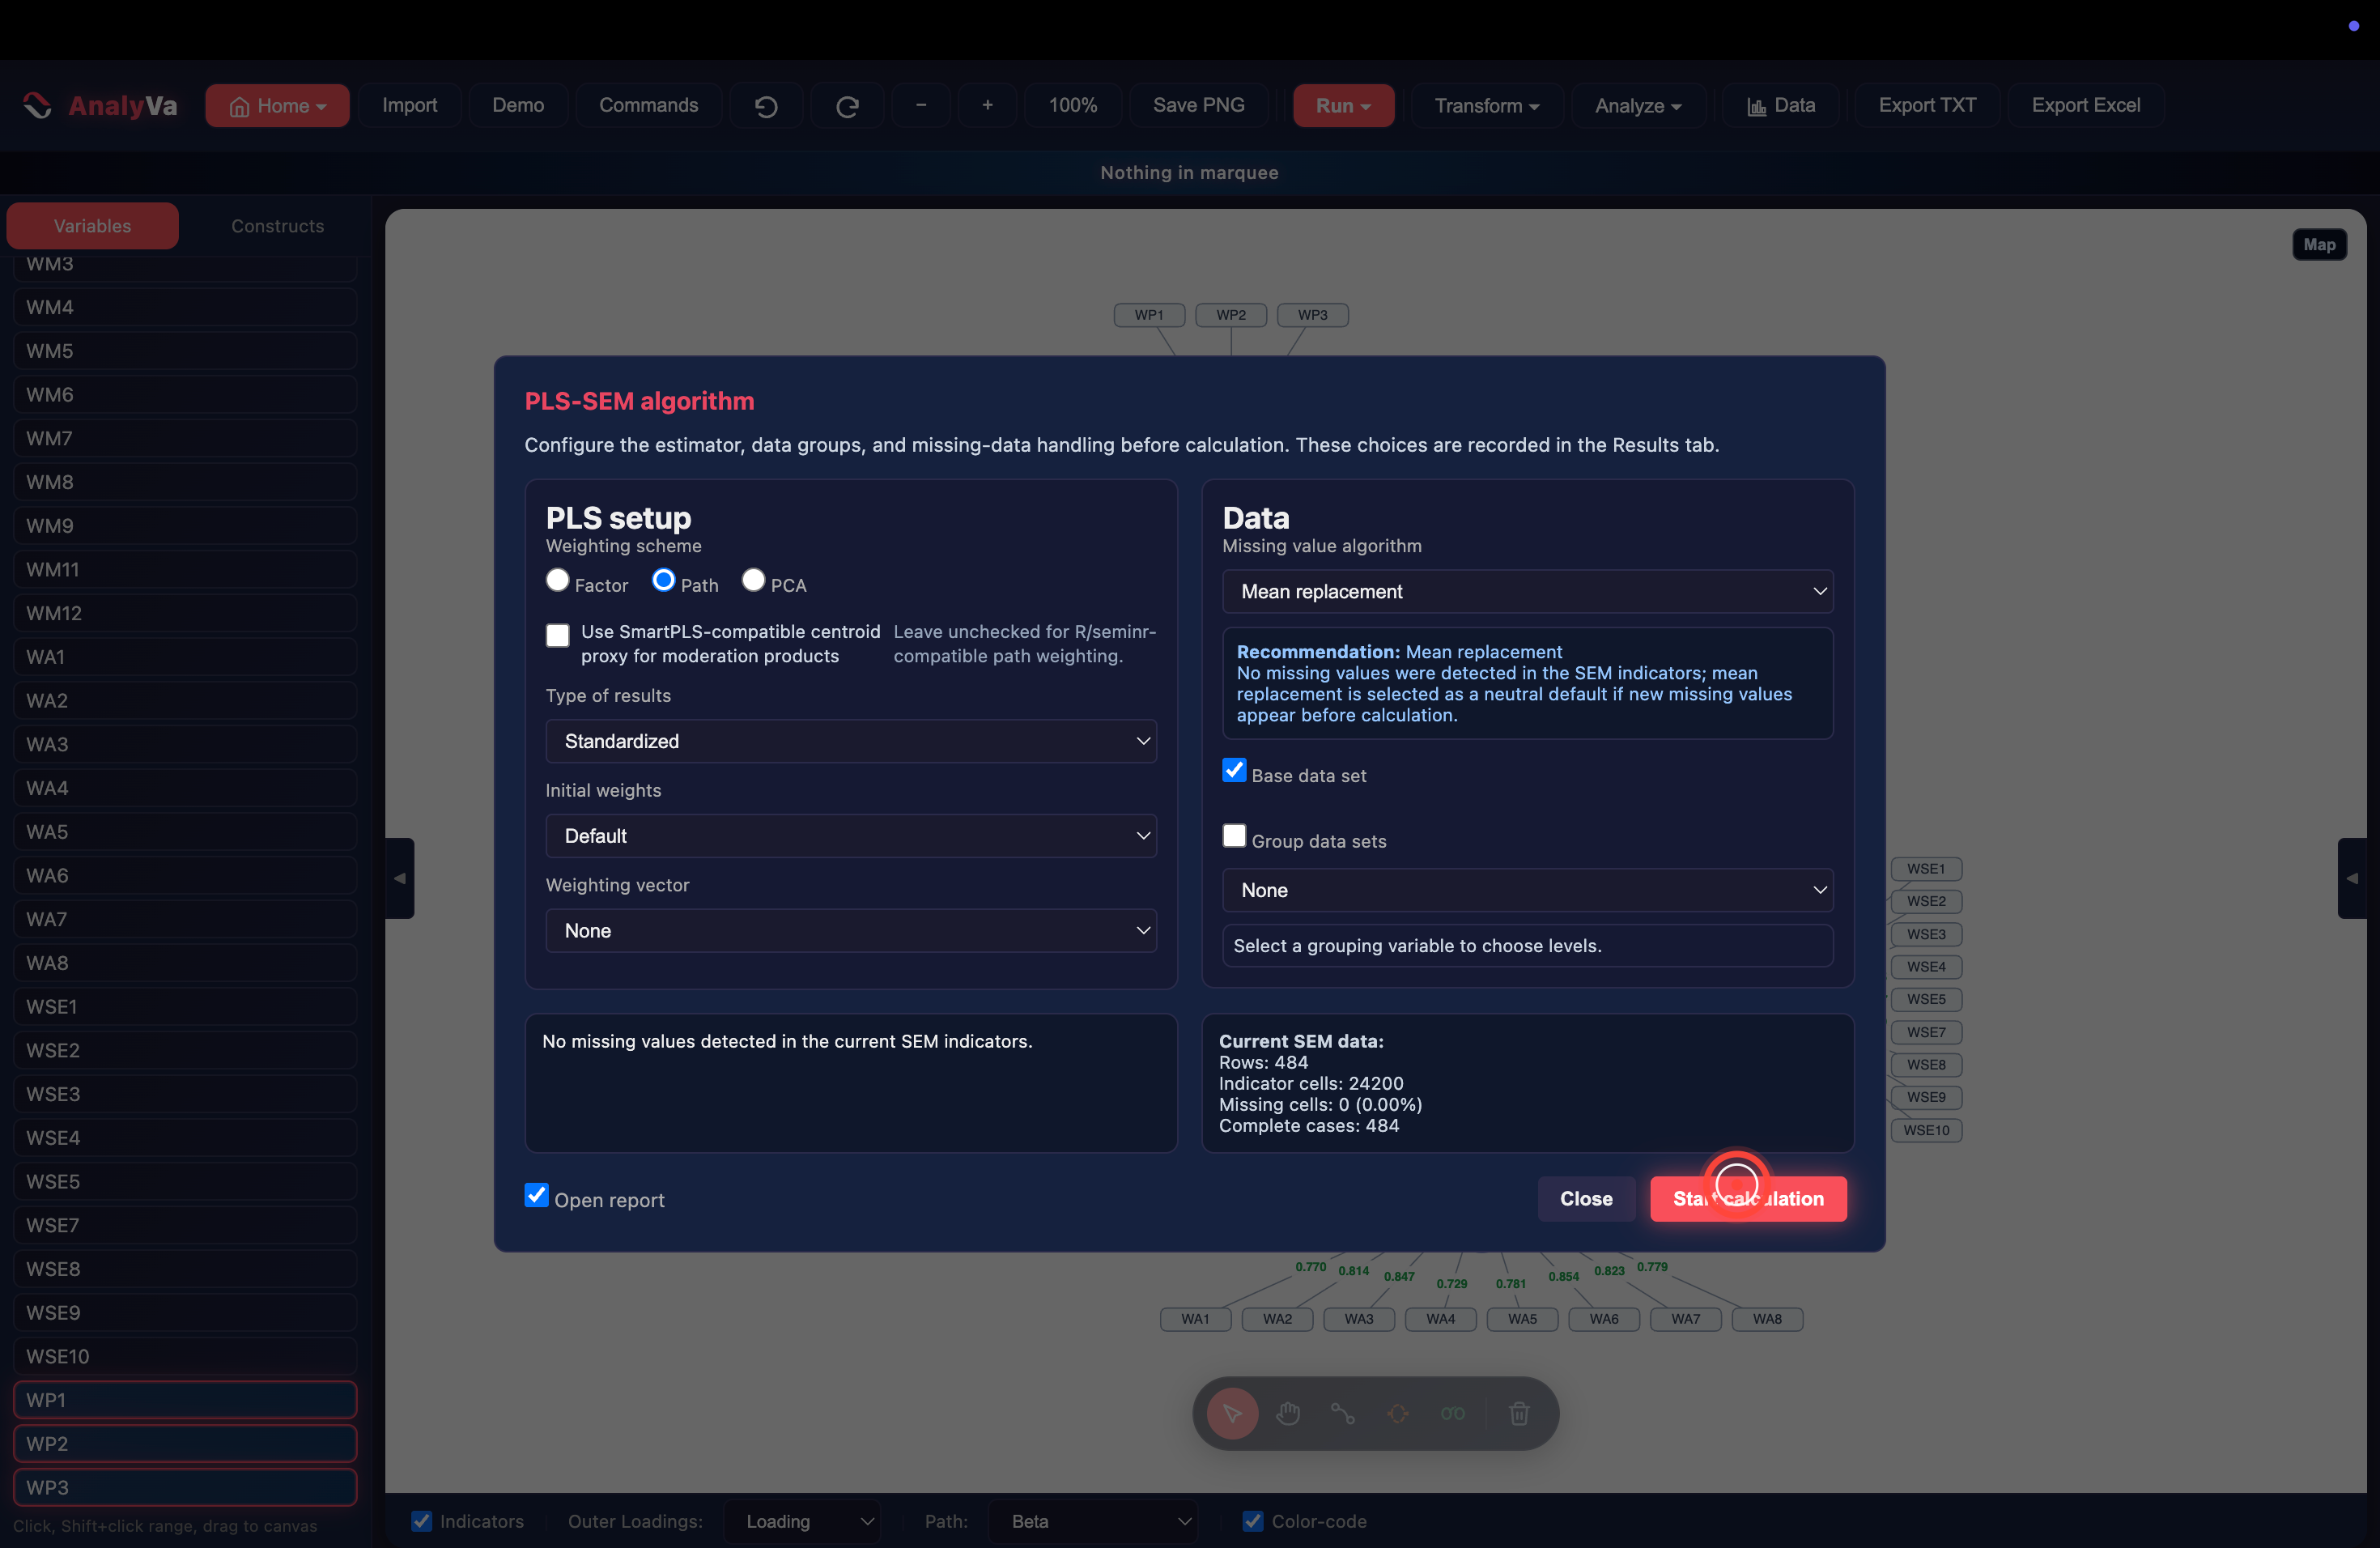
Step 8 — Check the moderation-specific setup option, then start. The configuration dialog has the same Path/Factor/PCA weighting choice as before, plus one option that only matters for moderation models: Use SmartPLS-compatible centroid proxy for moderation products. Leaving it unchecked matches R/seminr-style path weighting; checking it matches SmartPLS’s centroid approach for building interaction terms. Pick whichever matches the software you’re benchmarking against, then click Start calculation.
Adding the moderator changes the outcome construct’s explanatory power: WSE’s R² moves from 0.335 in the unmoderated model to 0.366 here — the four interaction terms and WP’s direct effect together account for that gain.
Bootstrapping for significance
Path coefficients alone don’t tell you which moderation effects are real. That requires bootstrapping.
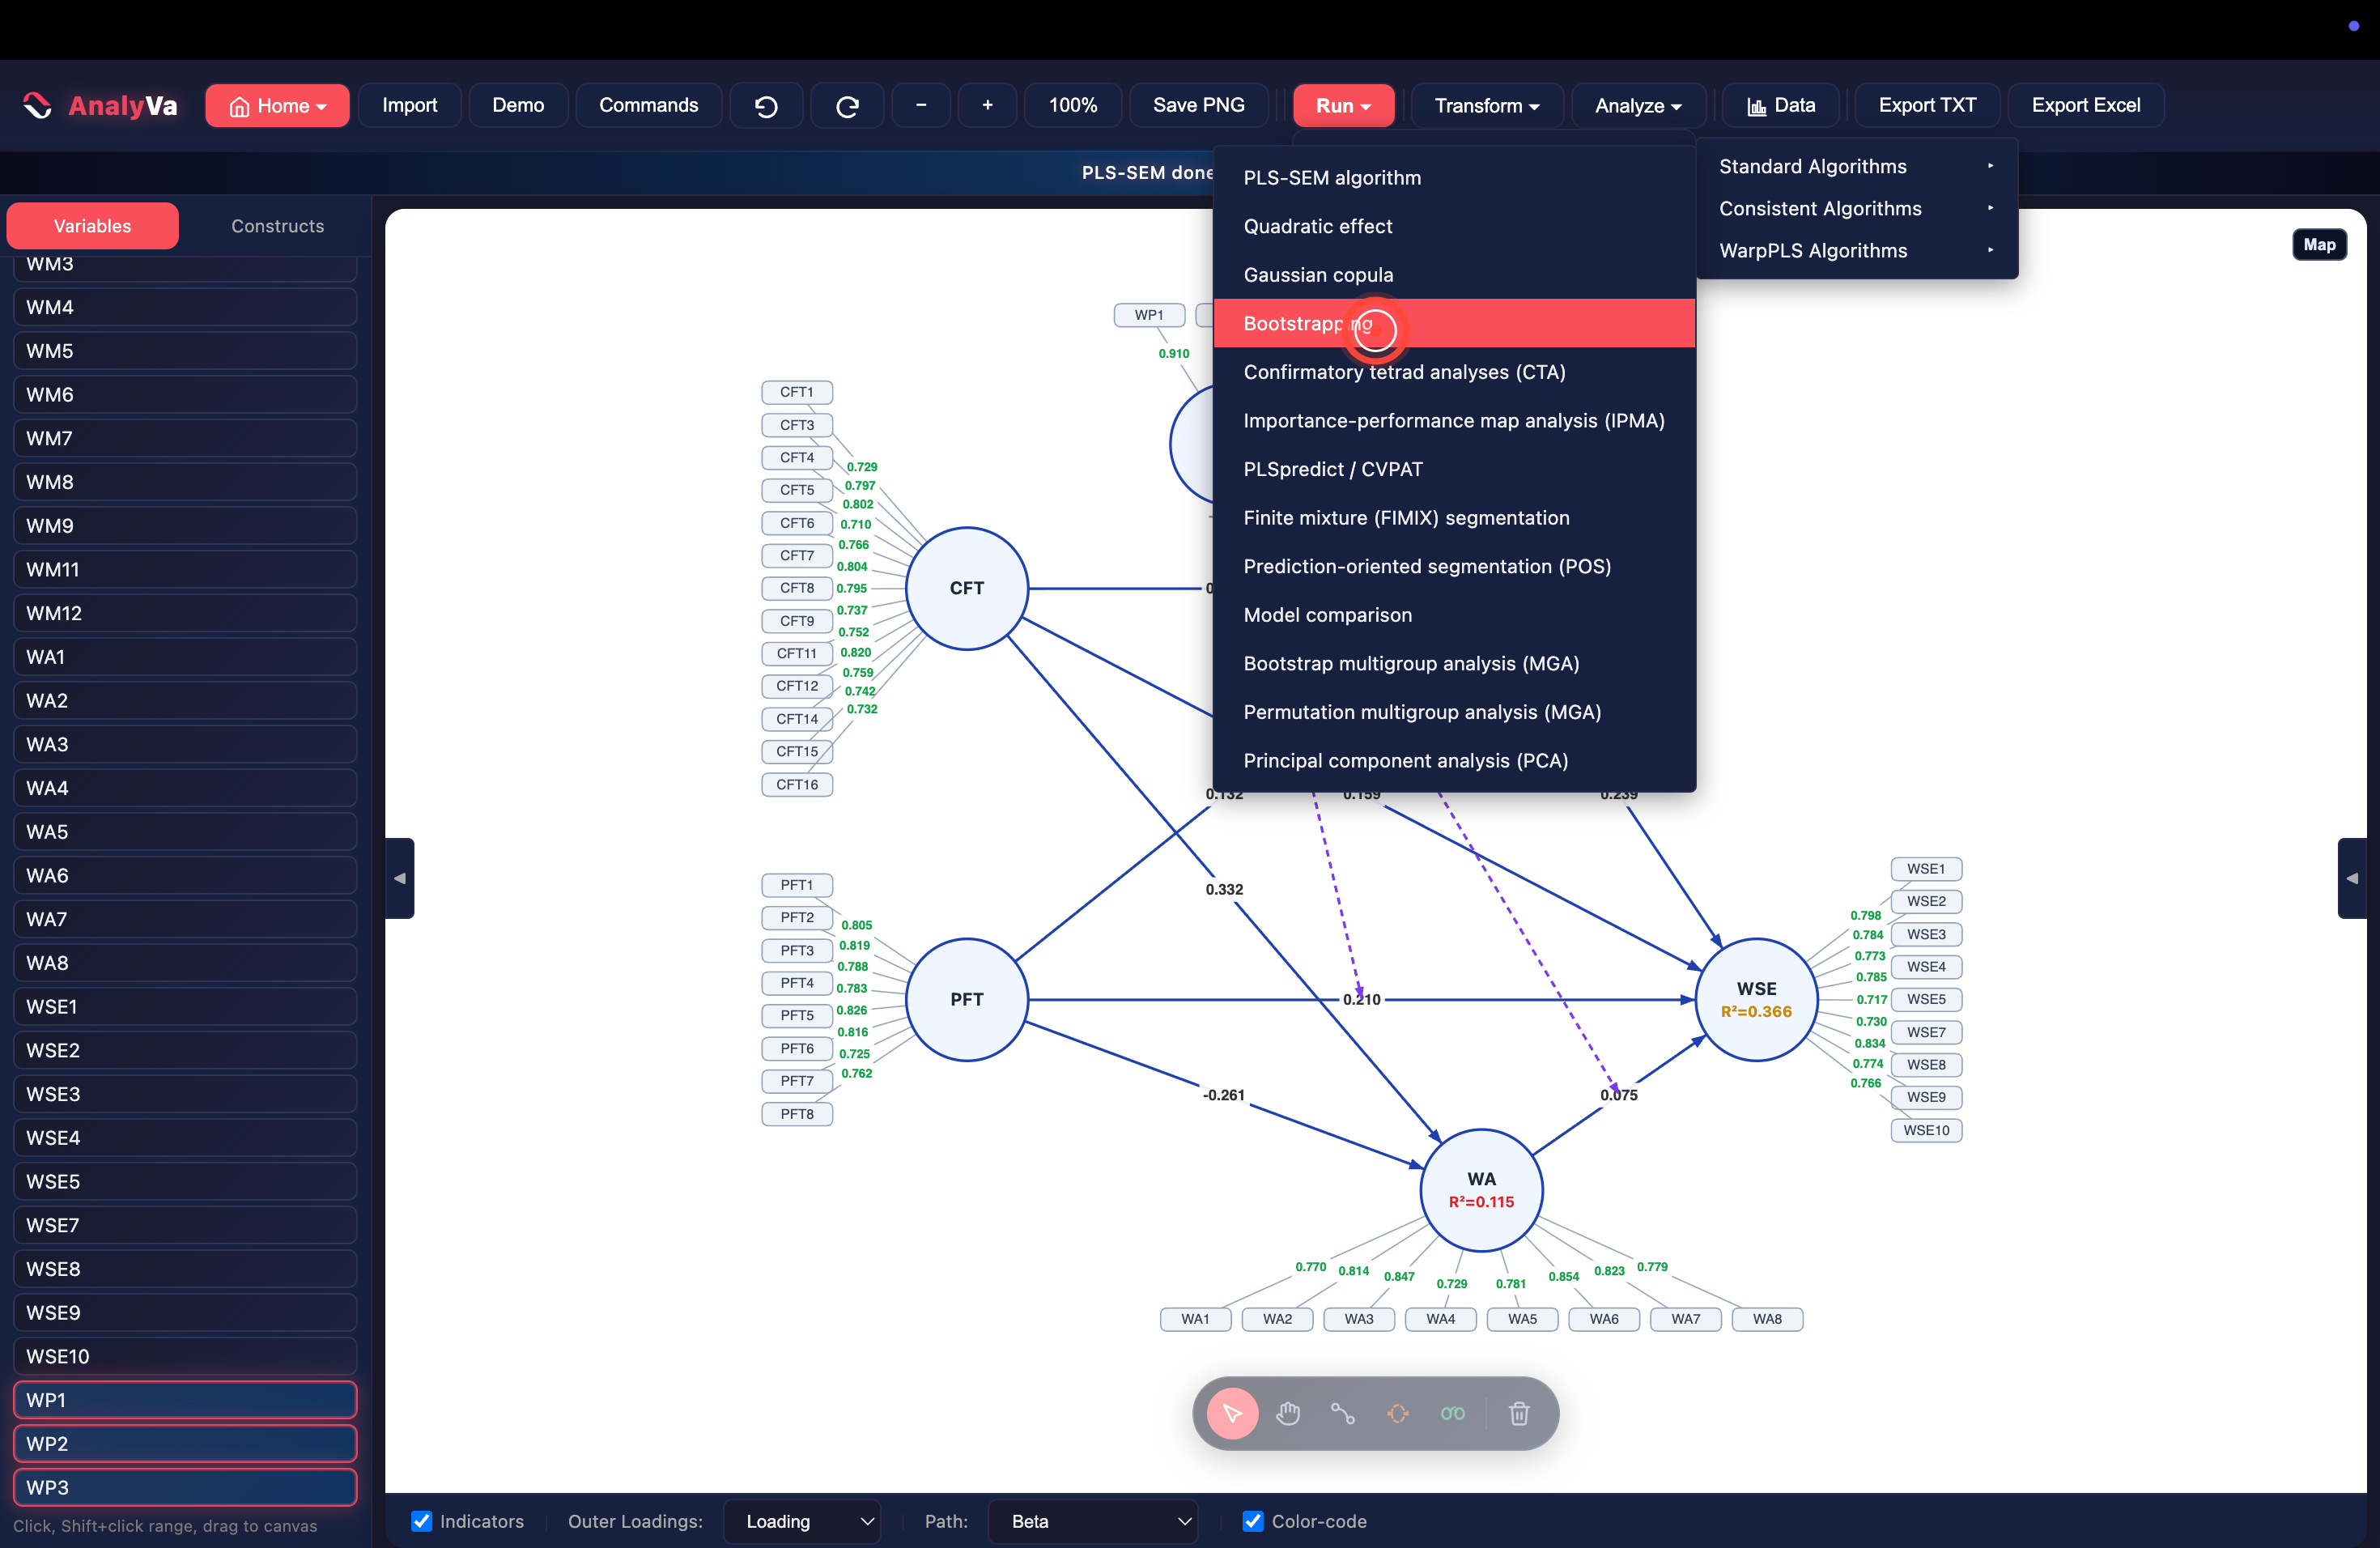
Step 9 — Open Run → PLS-SEM → Bootstrapping.
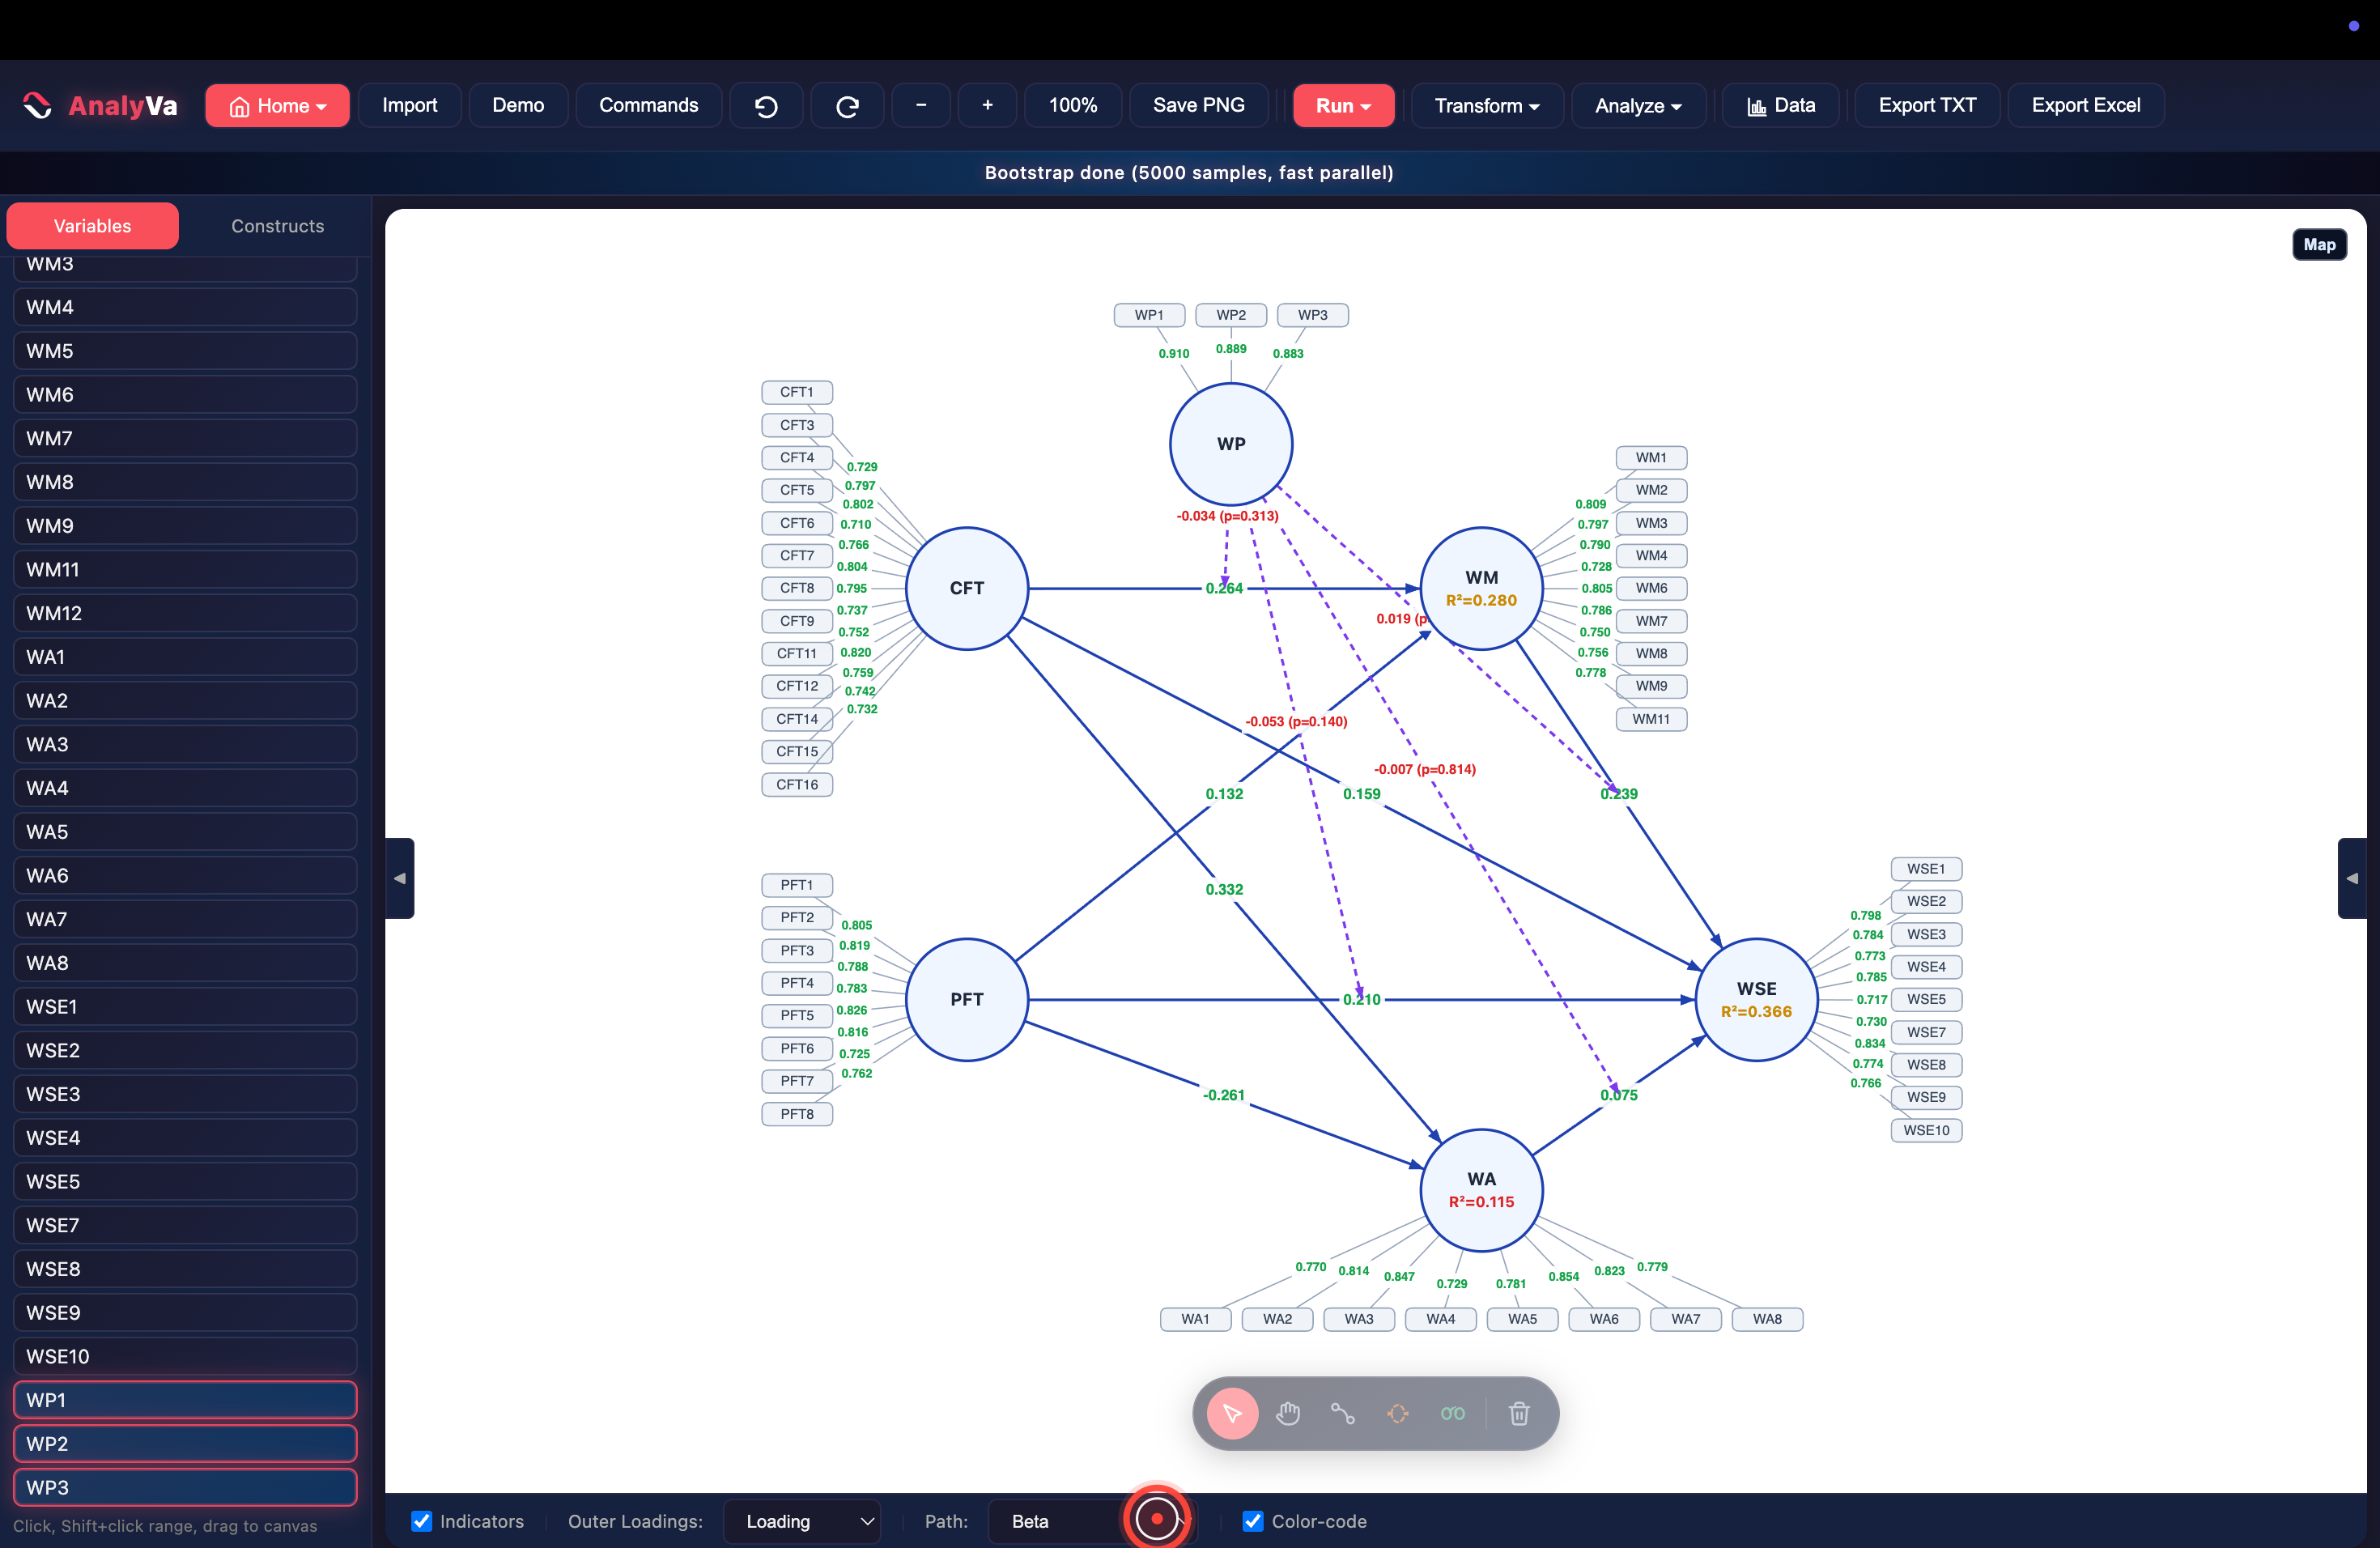
Step 10 — Read the Beta (p) display.
AnalyVa runs 5,000 bootstrap resamples (“fast parallel”) and, by
default, annotates each path with its coefficient and p-value inline:
-0.034 (p=0.313), -0.053 (p=0.140), -0.007 (p=0.814) — all three
visible interaction terms here are non-significant at conventional
thresholds.
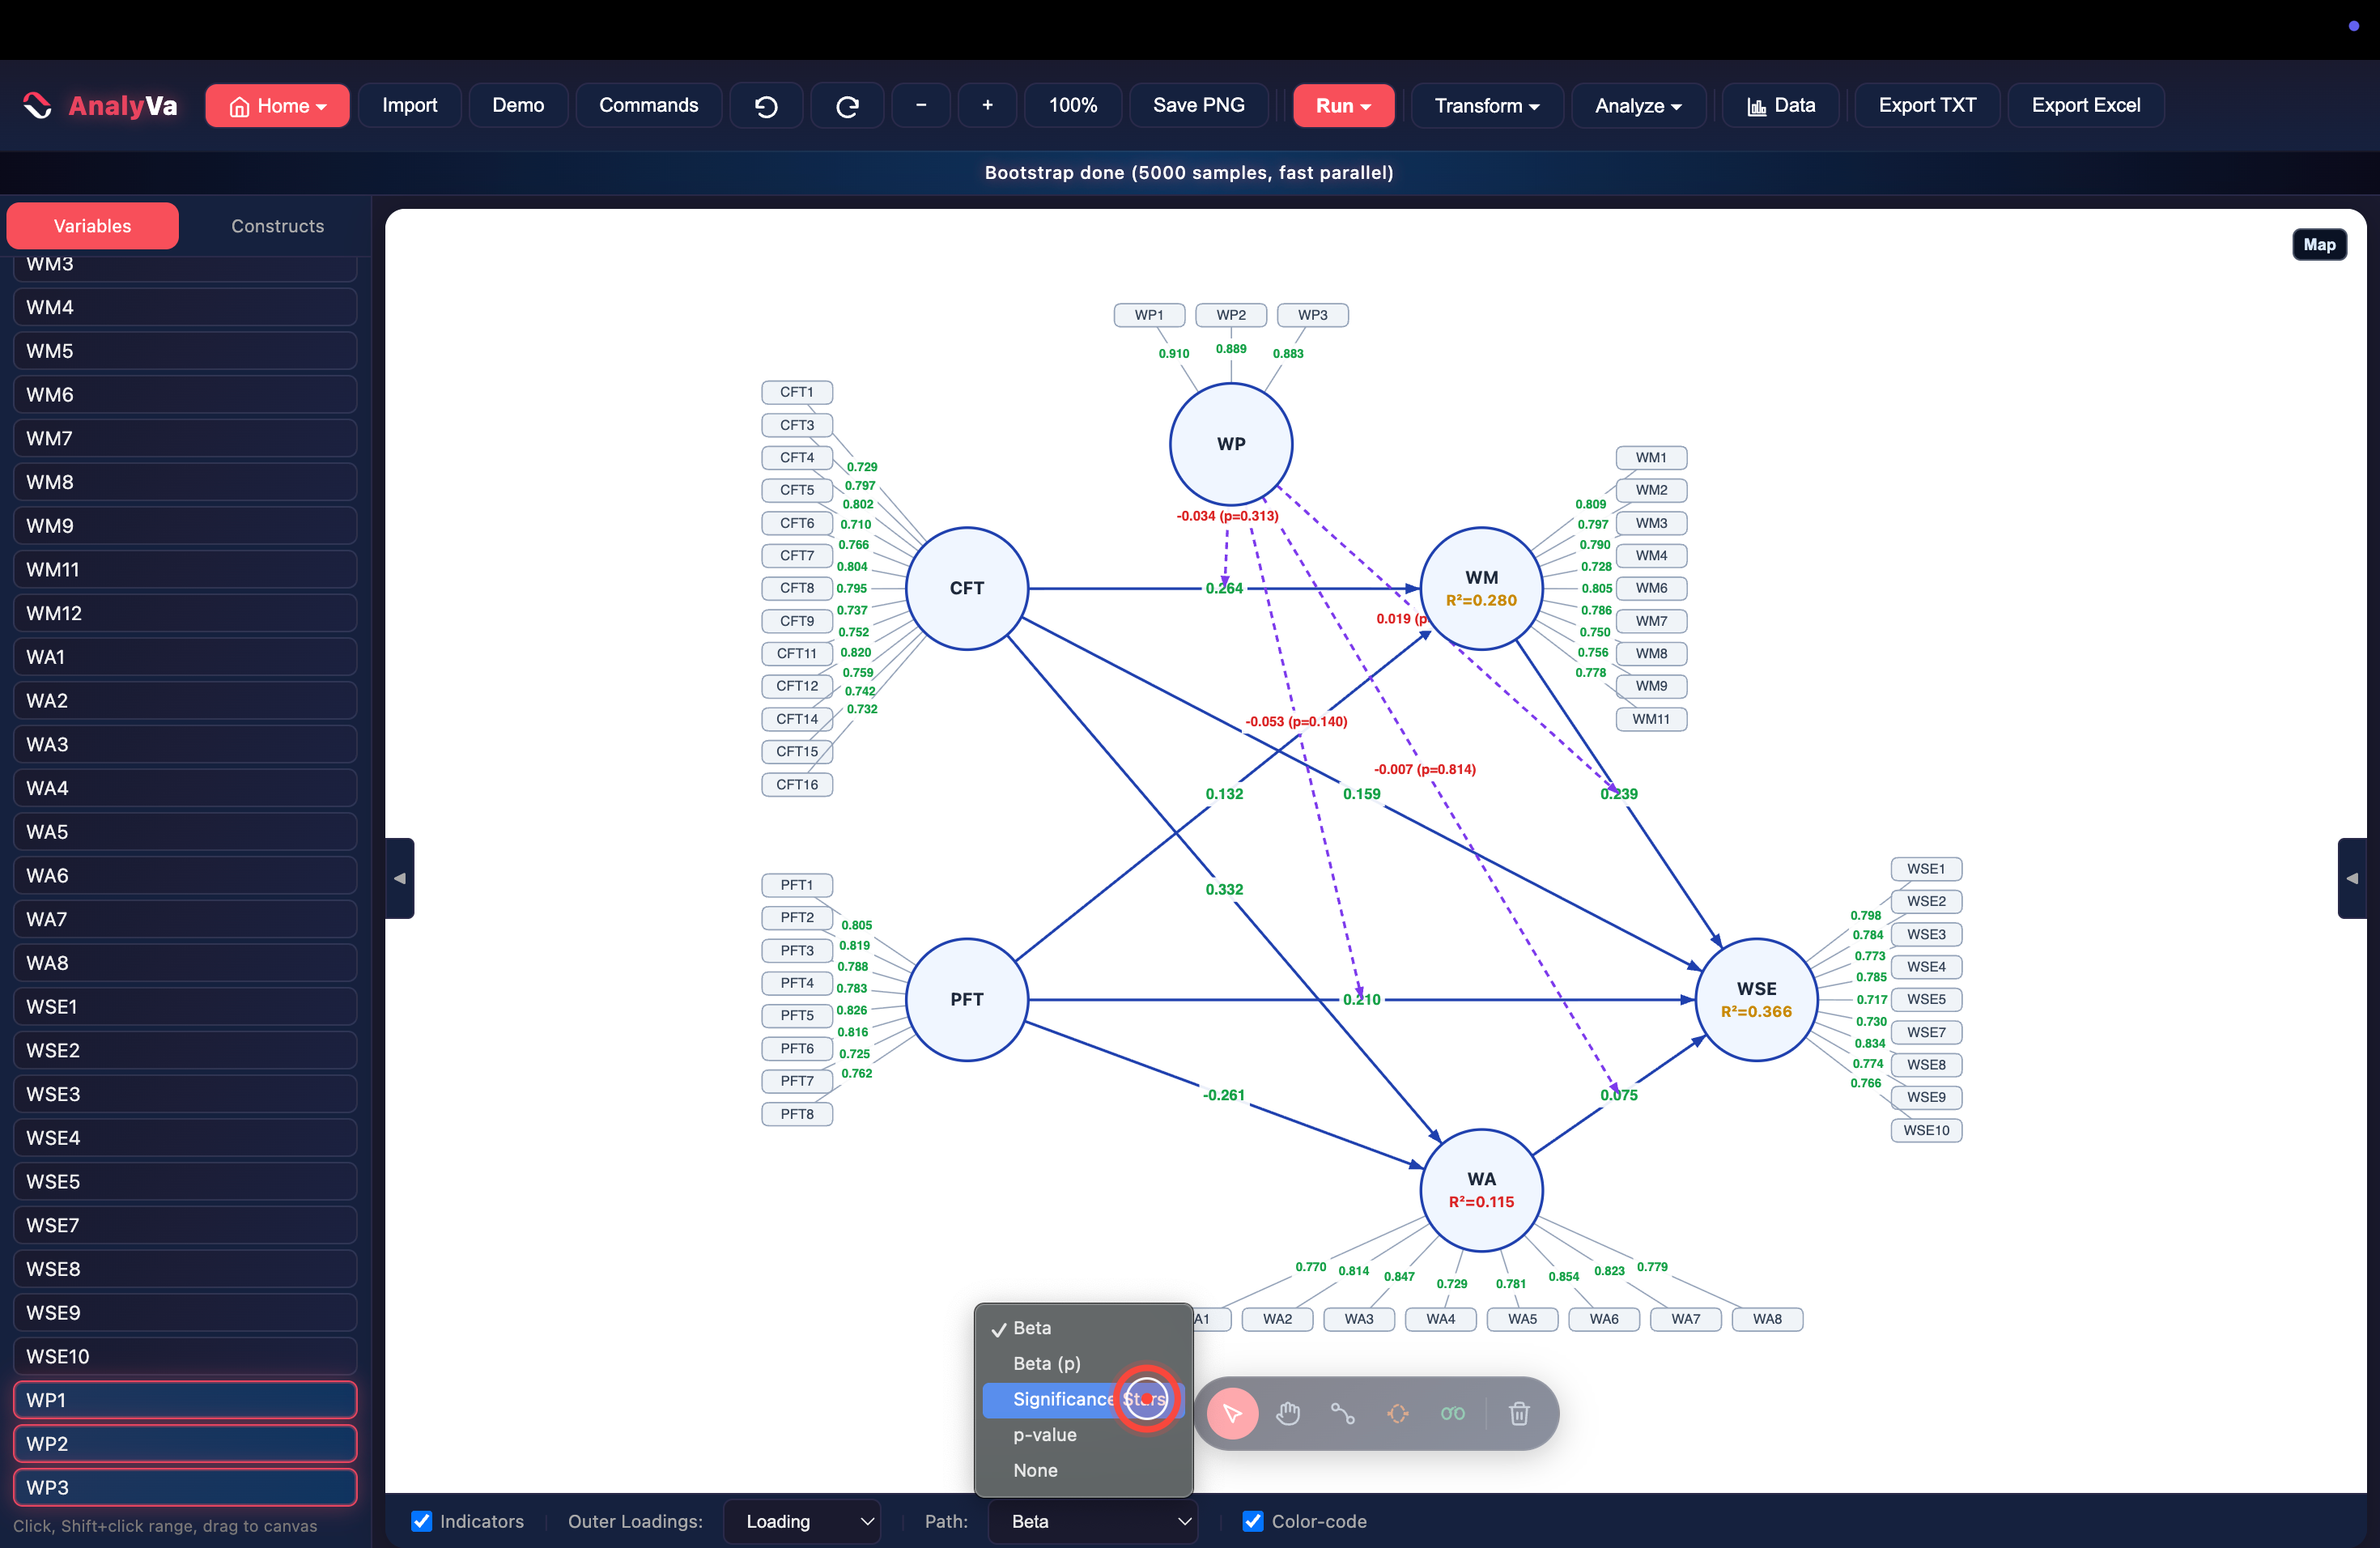
Step 11 — Switch the Path display to Significance Stars. The dropdown at the bottom toolbar controls how path values render: Beta, Beta (p), Significance Stars, p-value, or None. Switching to Significance Stars trades exact p-values for a faster visual scan — useful once you already know roughly where the interesting cases are.
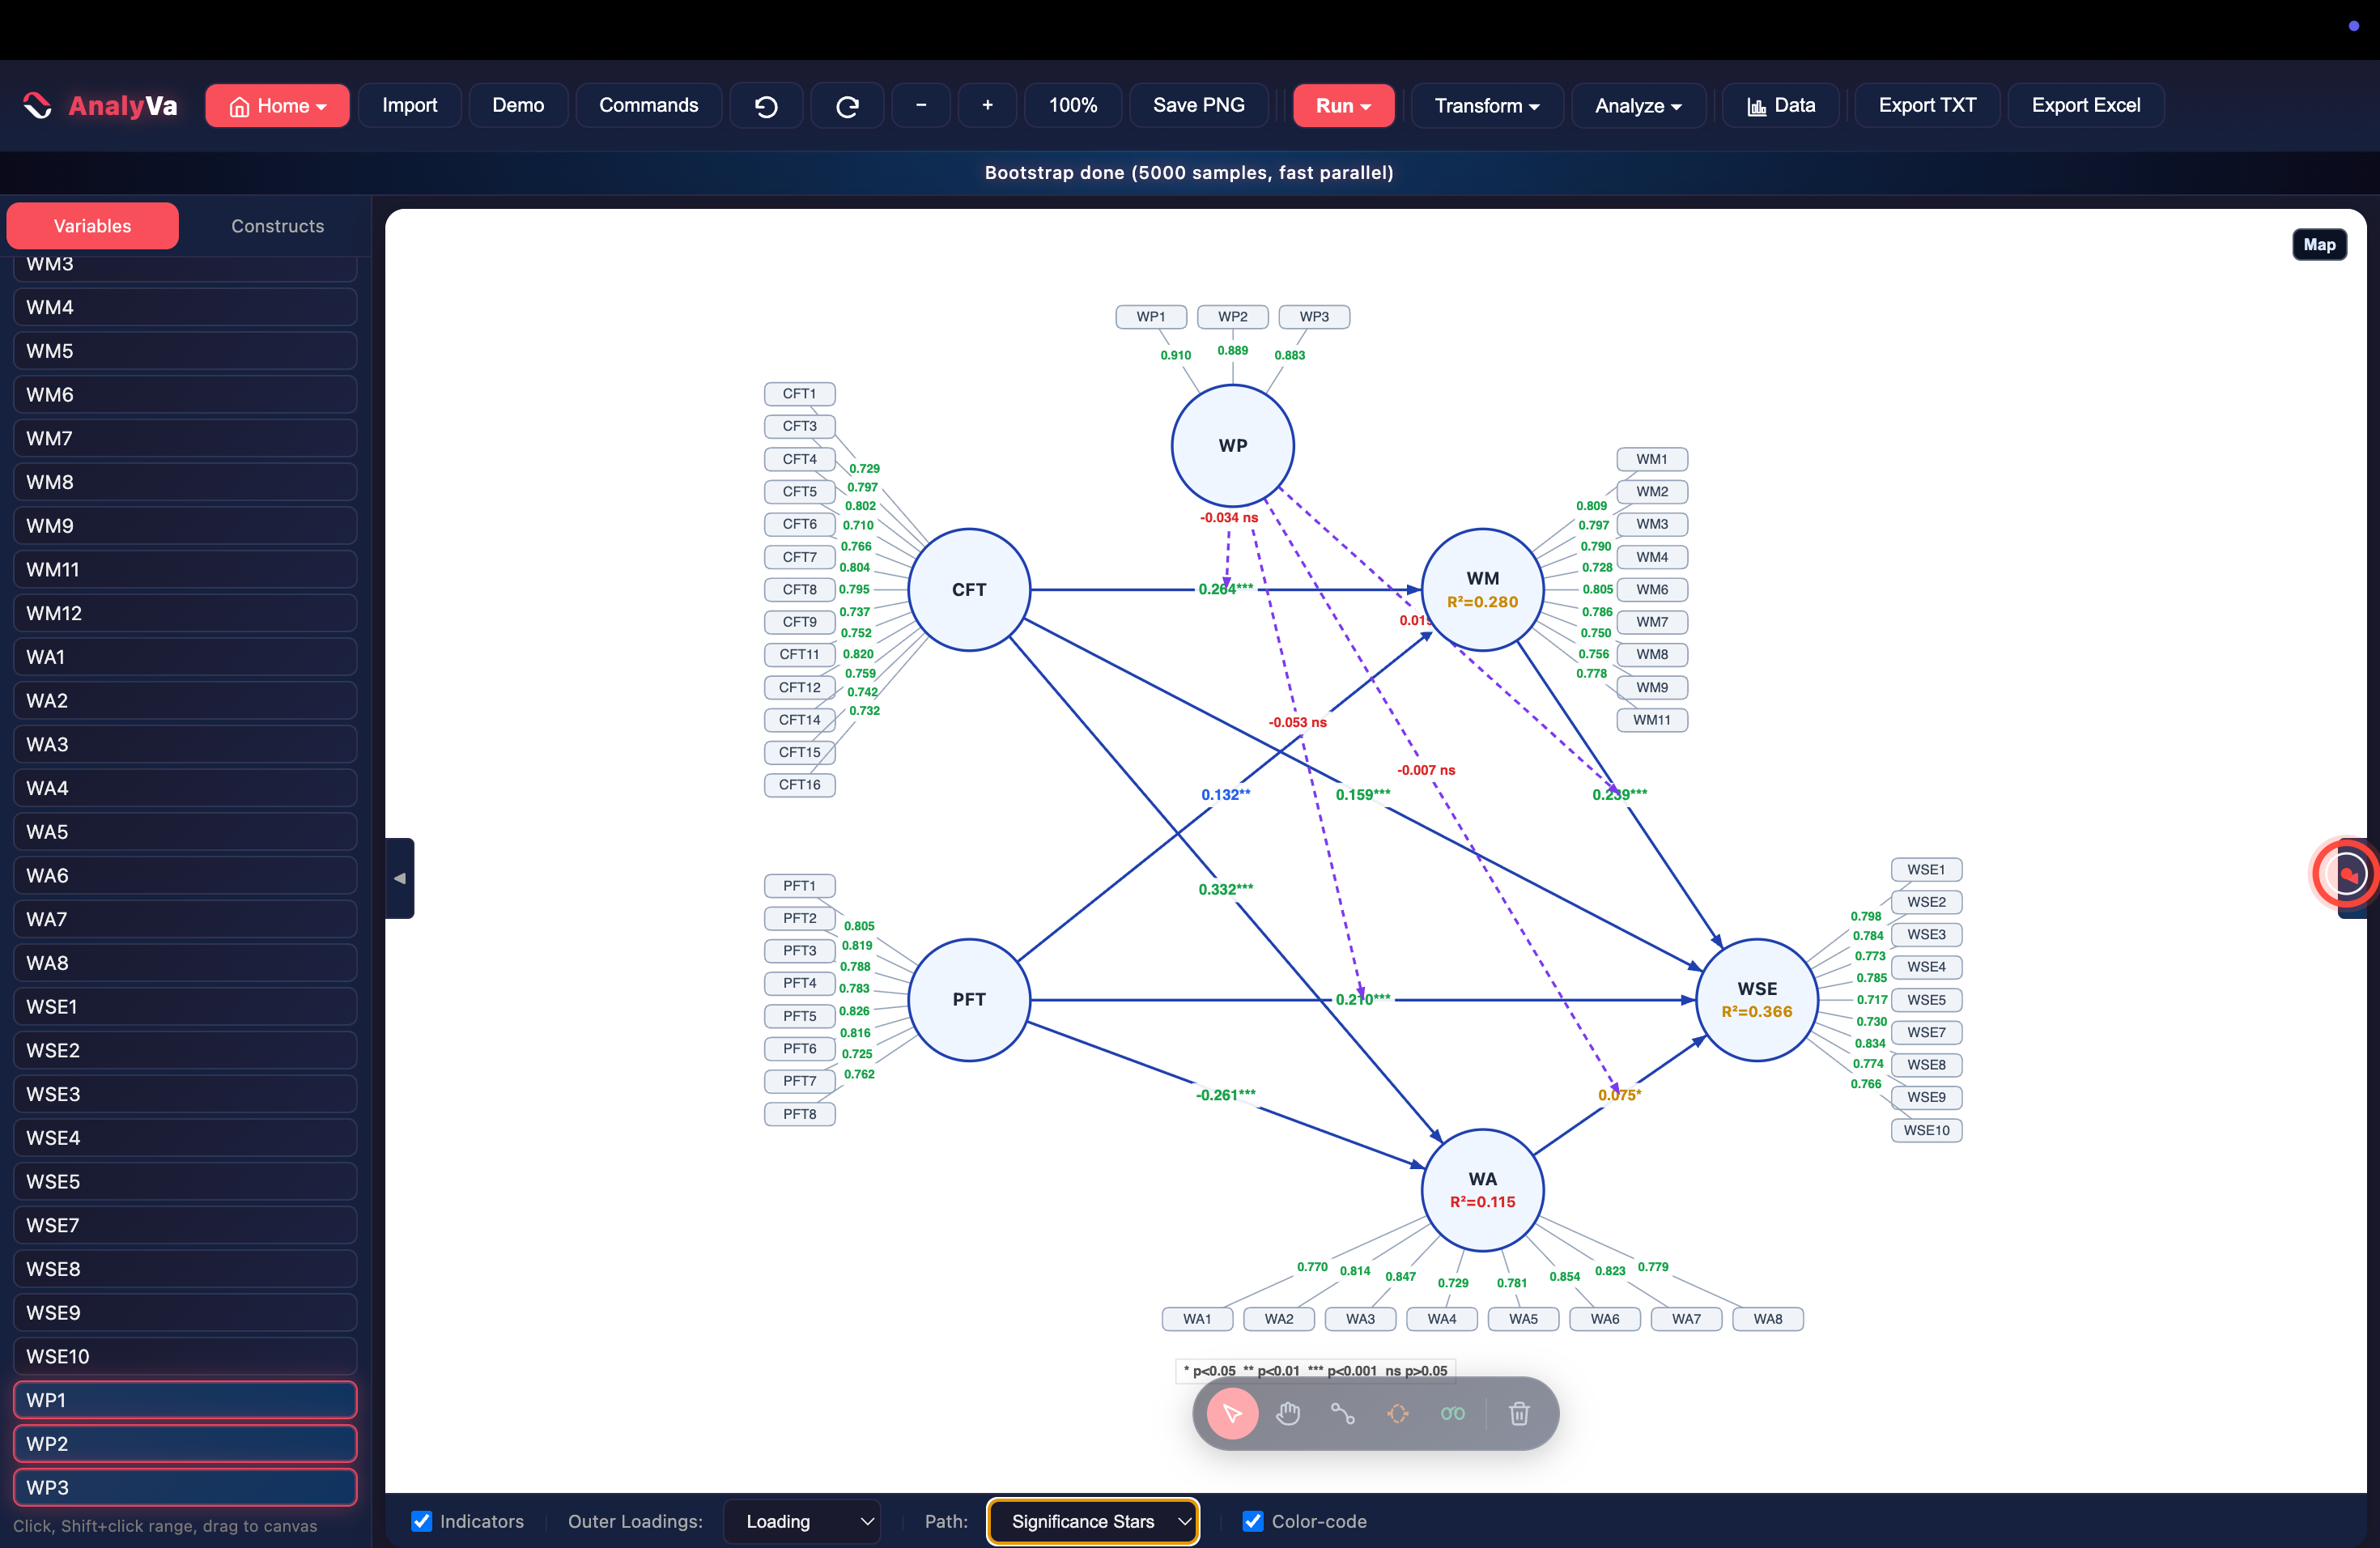
Step 12 — Read the starred diagram.
Every path now carries ***, **, *, or ns, with a legend at the
bottom of the canvas (* p<0.05 ** p<0.01 *** p<0.001 ns p>0.05).
All four interaction terms read ns. The direct paths — CFT → WSE,
WM → WSE, PFT → WSE — stay solidly significant at ***.
Reading the moderation table
Stars on the canvas are a summary. The Results panel has the full picture.
Step 13 — Open the Moderations (Interaction Effects) table. Below the standard bootstrap output, AnalyVa groups the four interaction terms into their own table with a plain-language effect label:
| Term | β | Effect |
|---|---|---|
| WP × WM → WSE | 0.0186 | Weak |
| WP × WA → WSE | −0.0071 | Weak |
| WP × PFT → WSE | −0.0529 | Moderate |
| WP × CFT → WM | −0.0337 | Weak |
None of the four reach a large effect size, and — cross-referencing the bootstrap table below — none reach significance either (p = 0.610, 0.814, 0.140, and 0.313 respectively). That’s a real, reportable result: this moderator doesn’t meaningfully change any of the four paths tested, at least not in this sample.
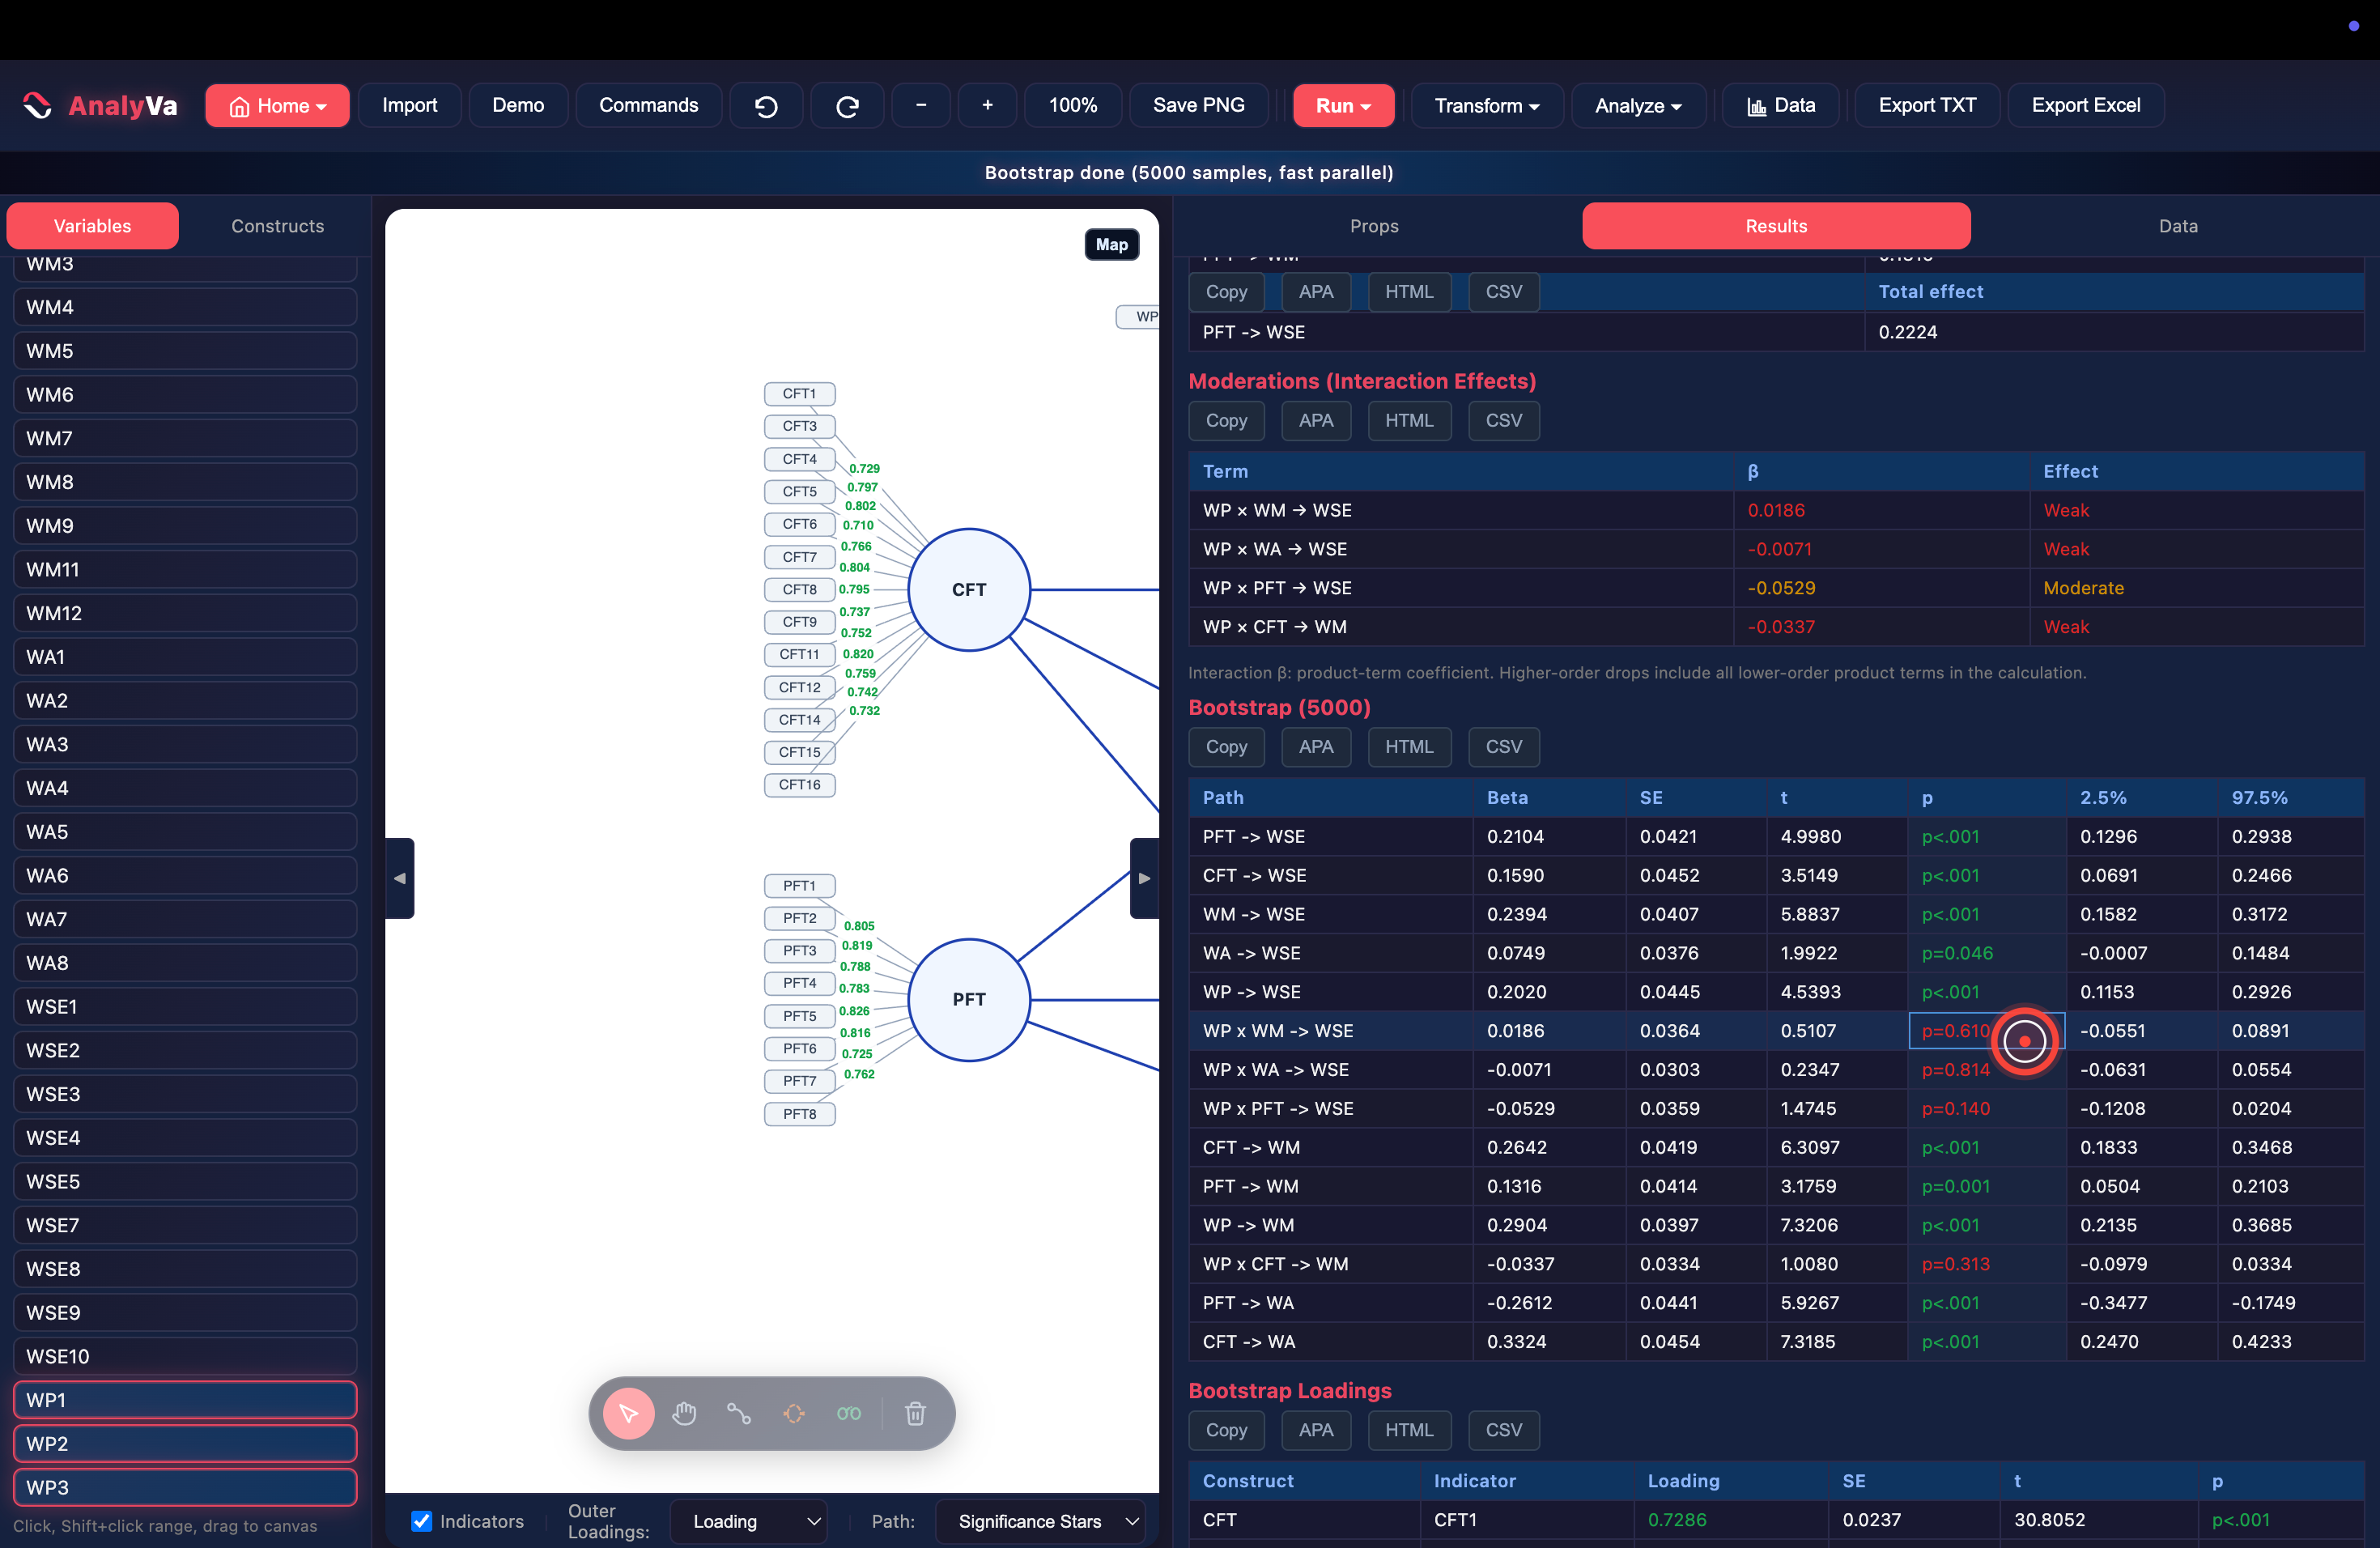
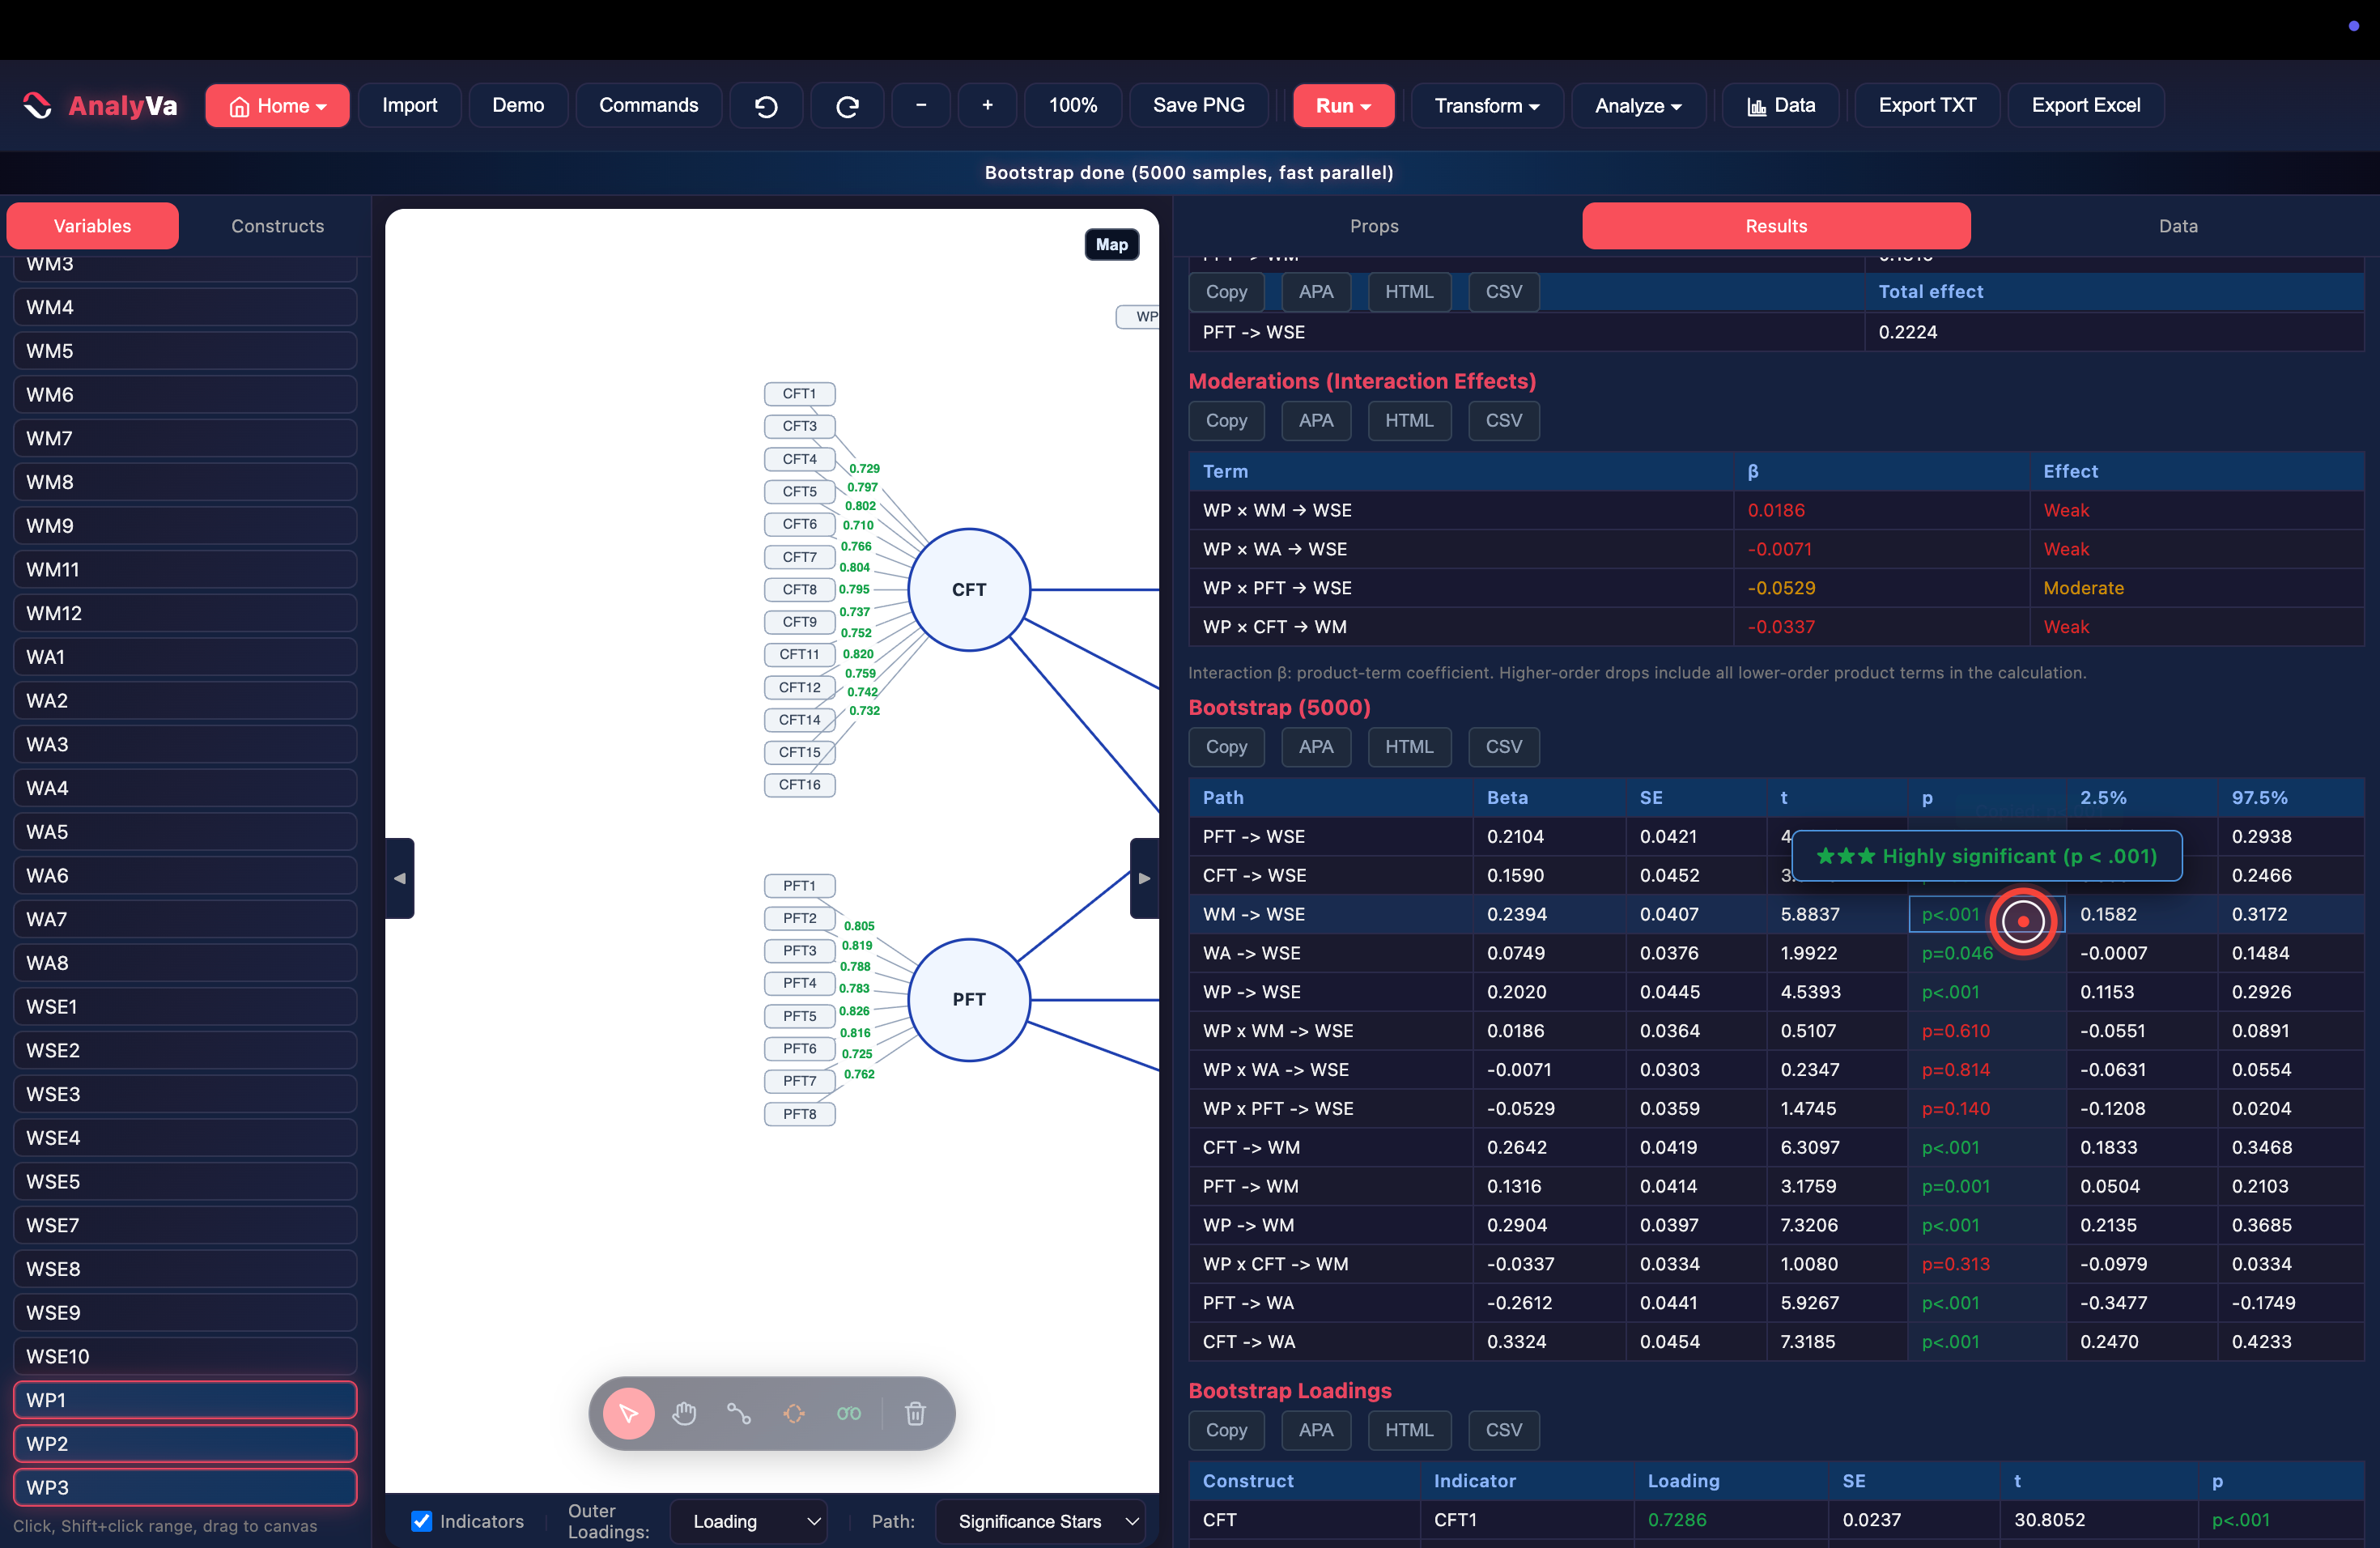
Step 14 — Cross-check with the full bootstrap table.
Every path — structural and interaction — gets its own row with Beta,
SE, t, p, and the 95% bootstrap confidence interval. Hovering any p
cell surfaces a plain-language tooltip (“★★★ Highly significant
(p < .001)”), which is a fast way to explain a results table to a
co-author who doesn’t read t-statistics fluently.
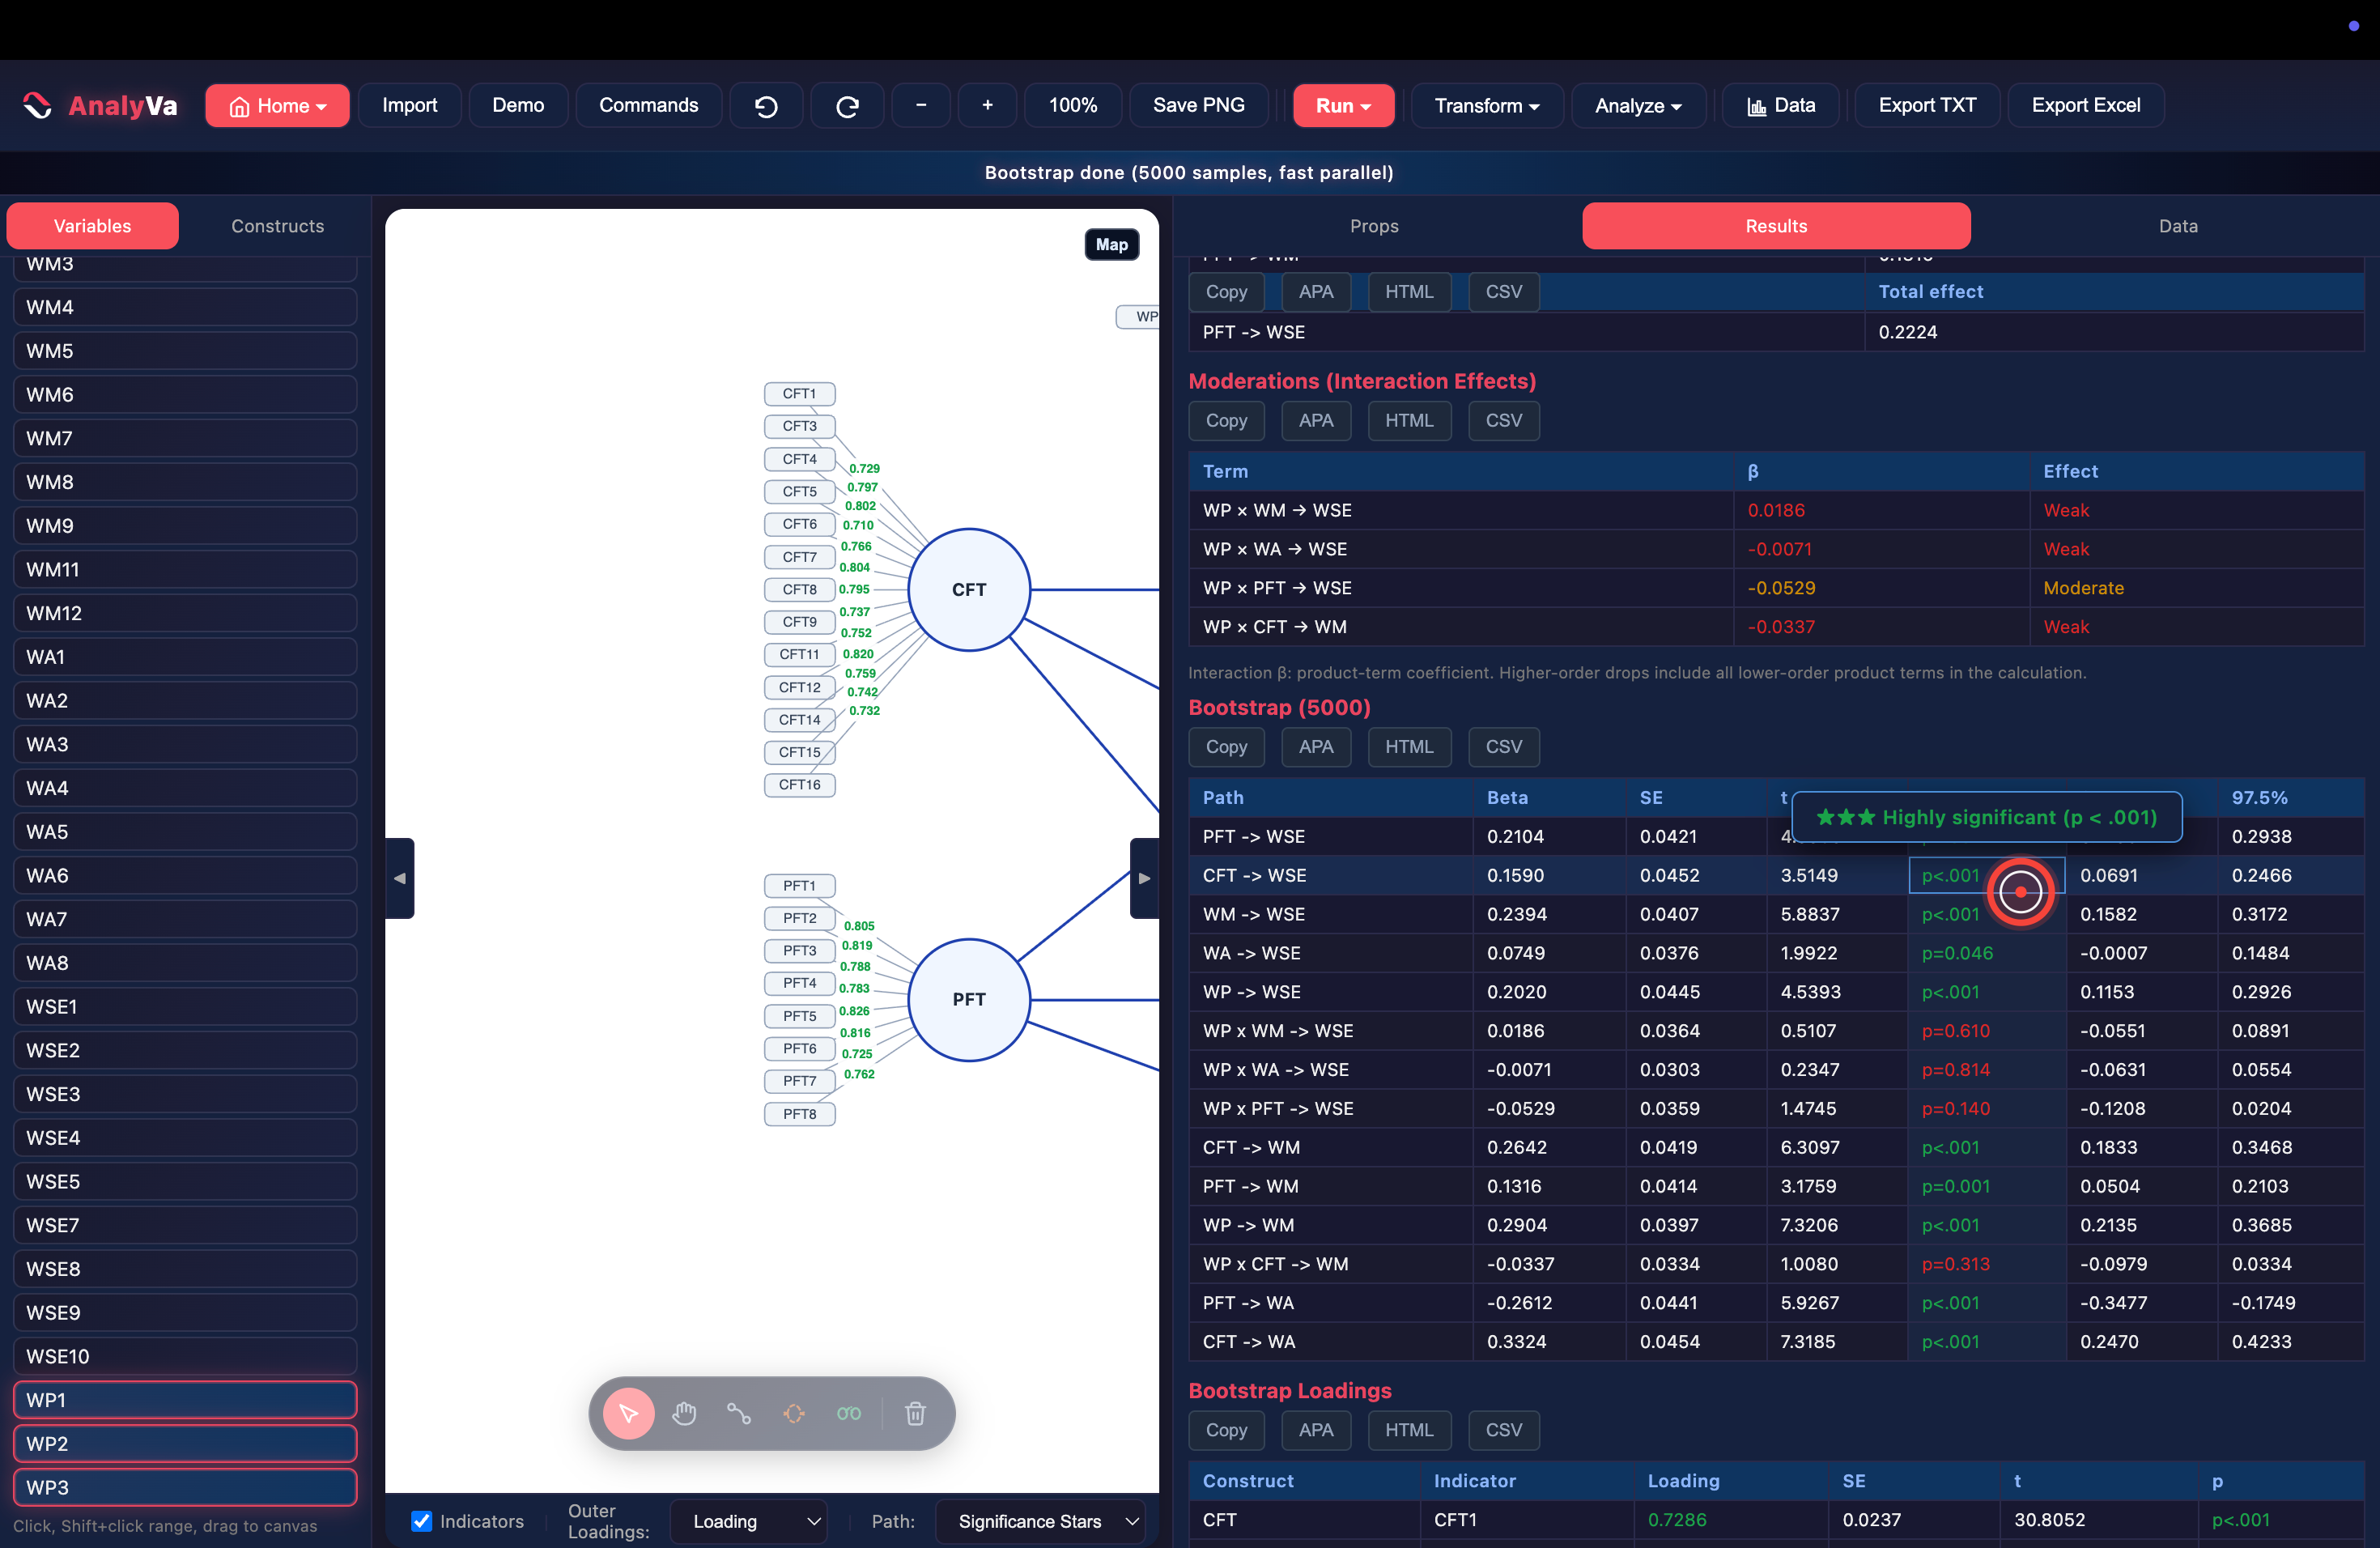
Step 15 — Note which paths are genuinely significant.
The base structural paths (PFT → WSE, CFT → WSE, WM → WSE, WP → WSE,
CFT → WM, PFT → WM, WP → WM) all clear p<.001. Only the interaction
terms are the non-significant group here — a pattern worth stating
explicitly in a manuscript: “the direct effects held; none of the
four hypothesized moderations were supported.”
Loadings and indirect effects, same run
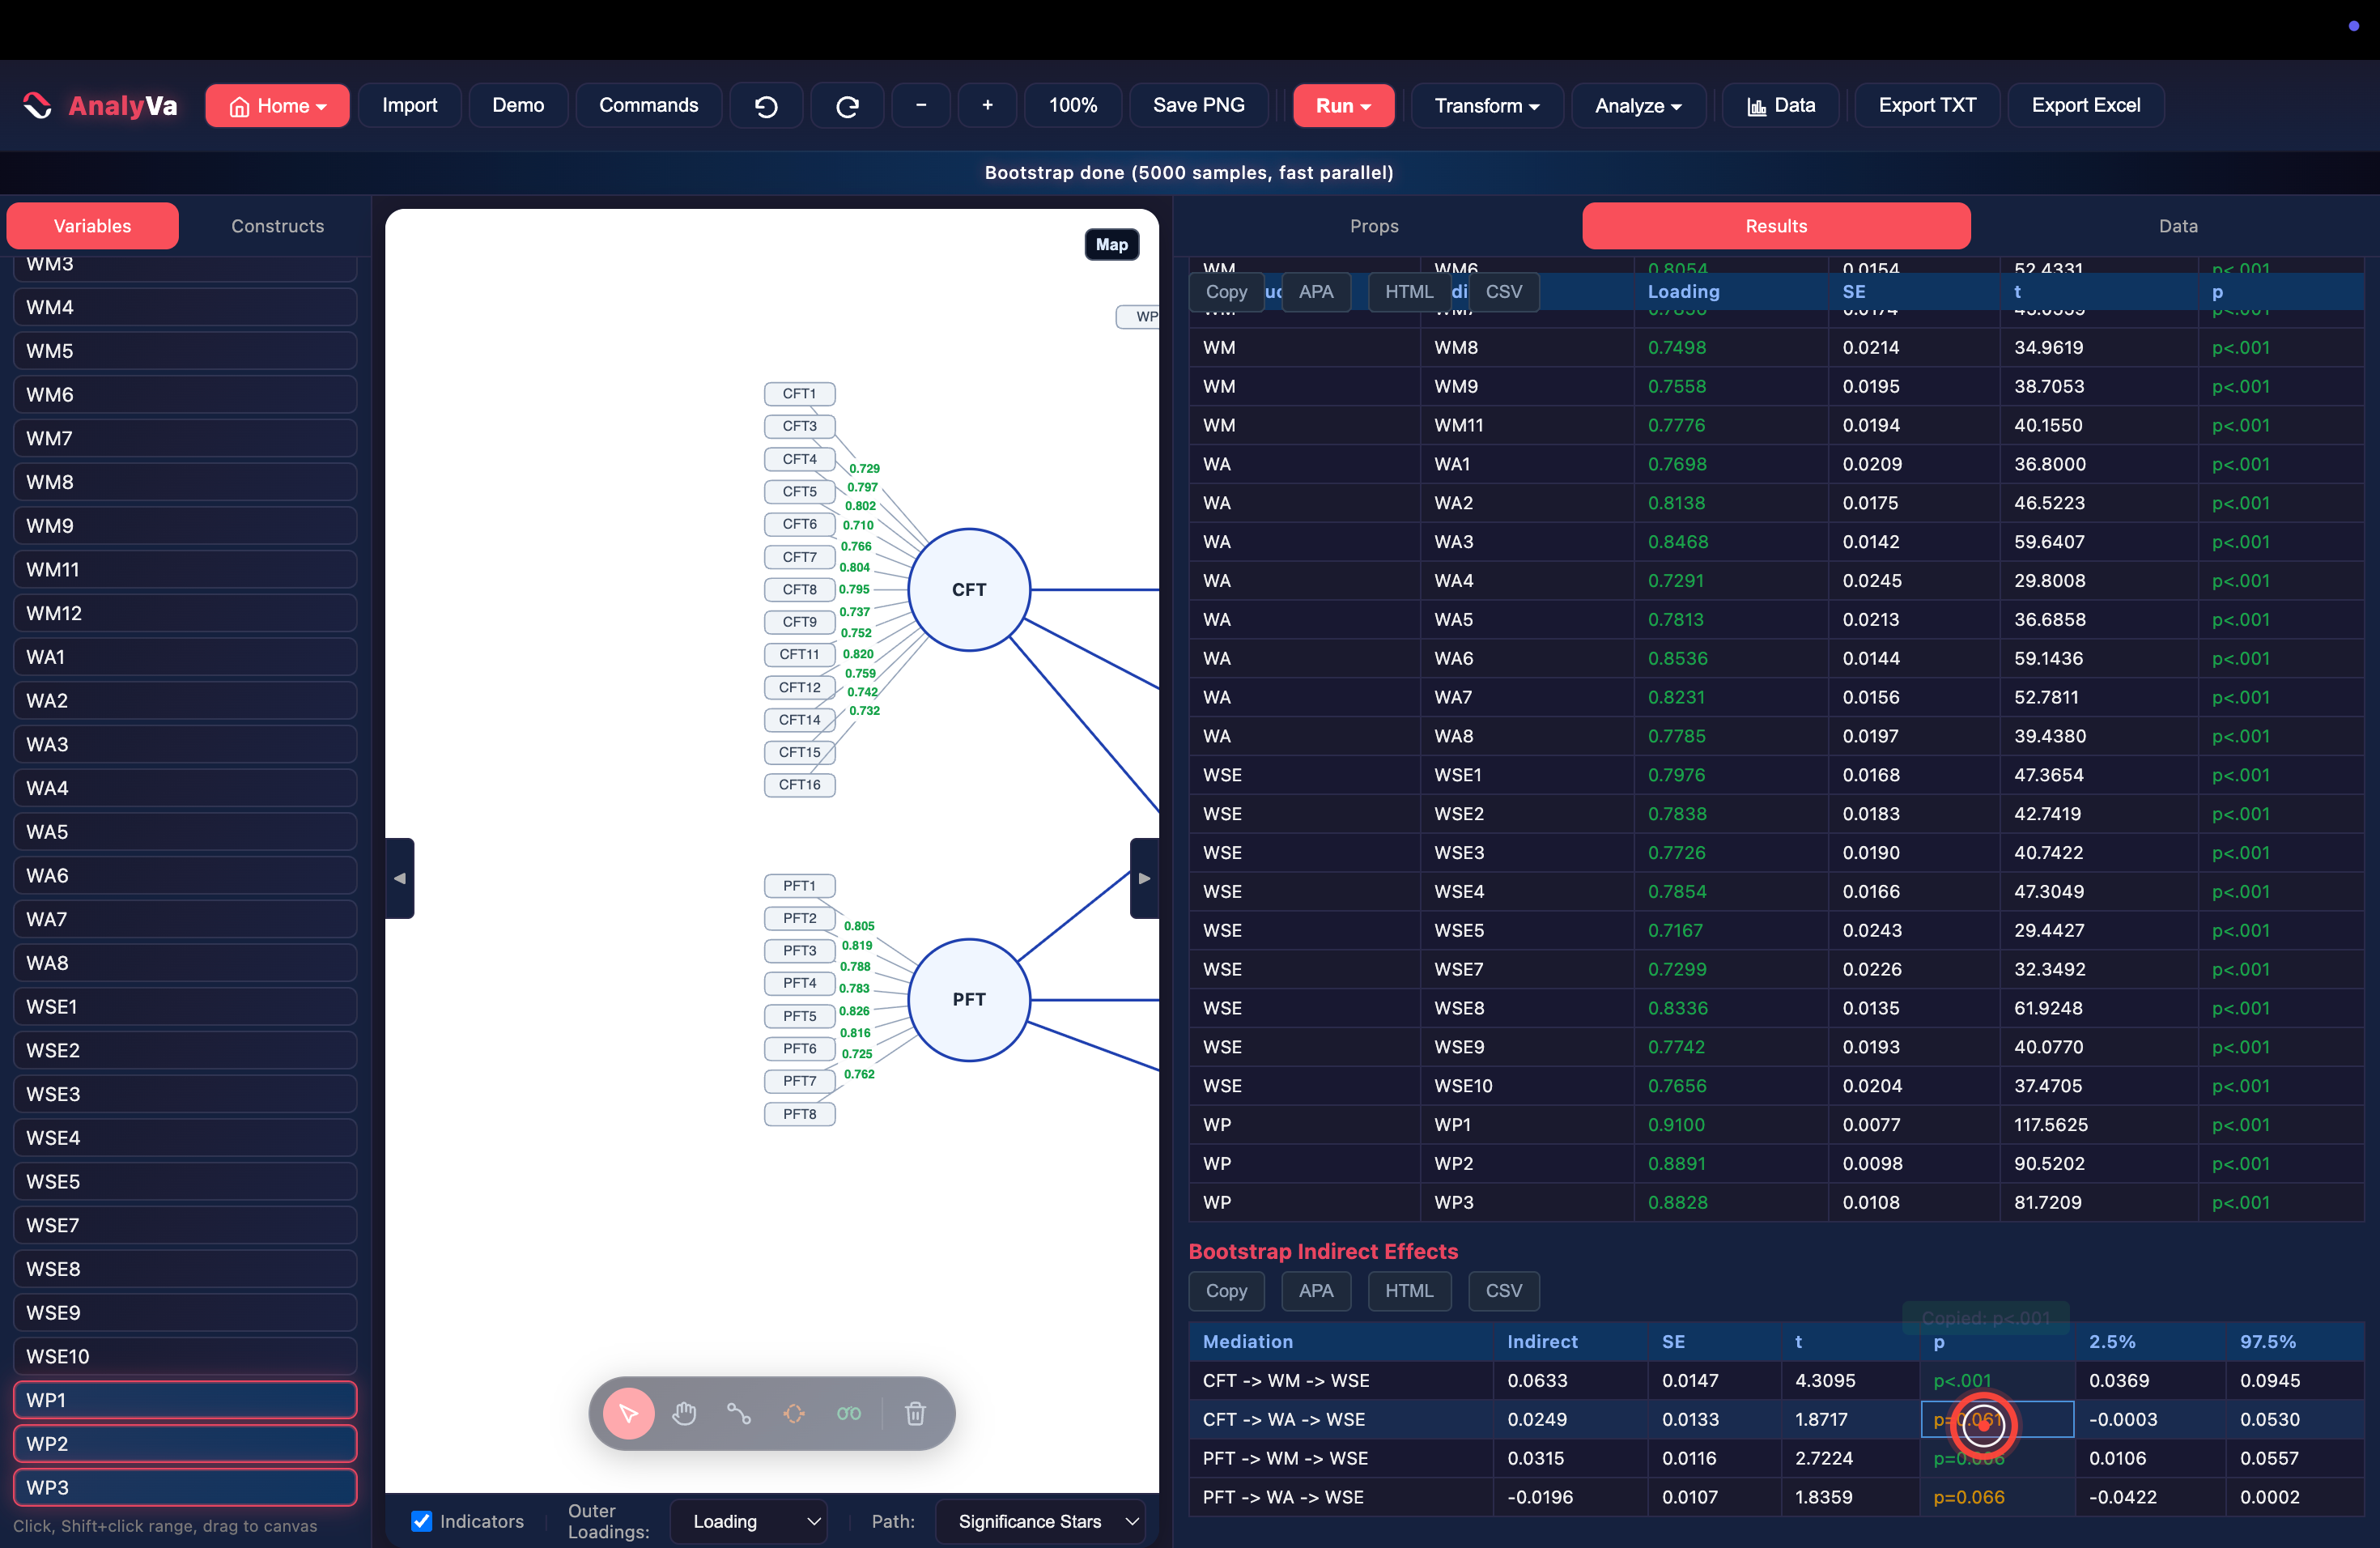
Step 16 — Scroll to Bootstrap Loadings.
The same 5,000-sample bootstrap also re-estimates every outer loading
with its own SE, t, and p — every indicator here clears p<.001.
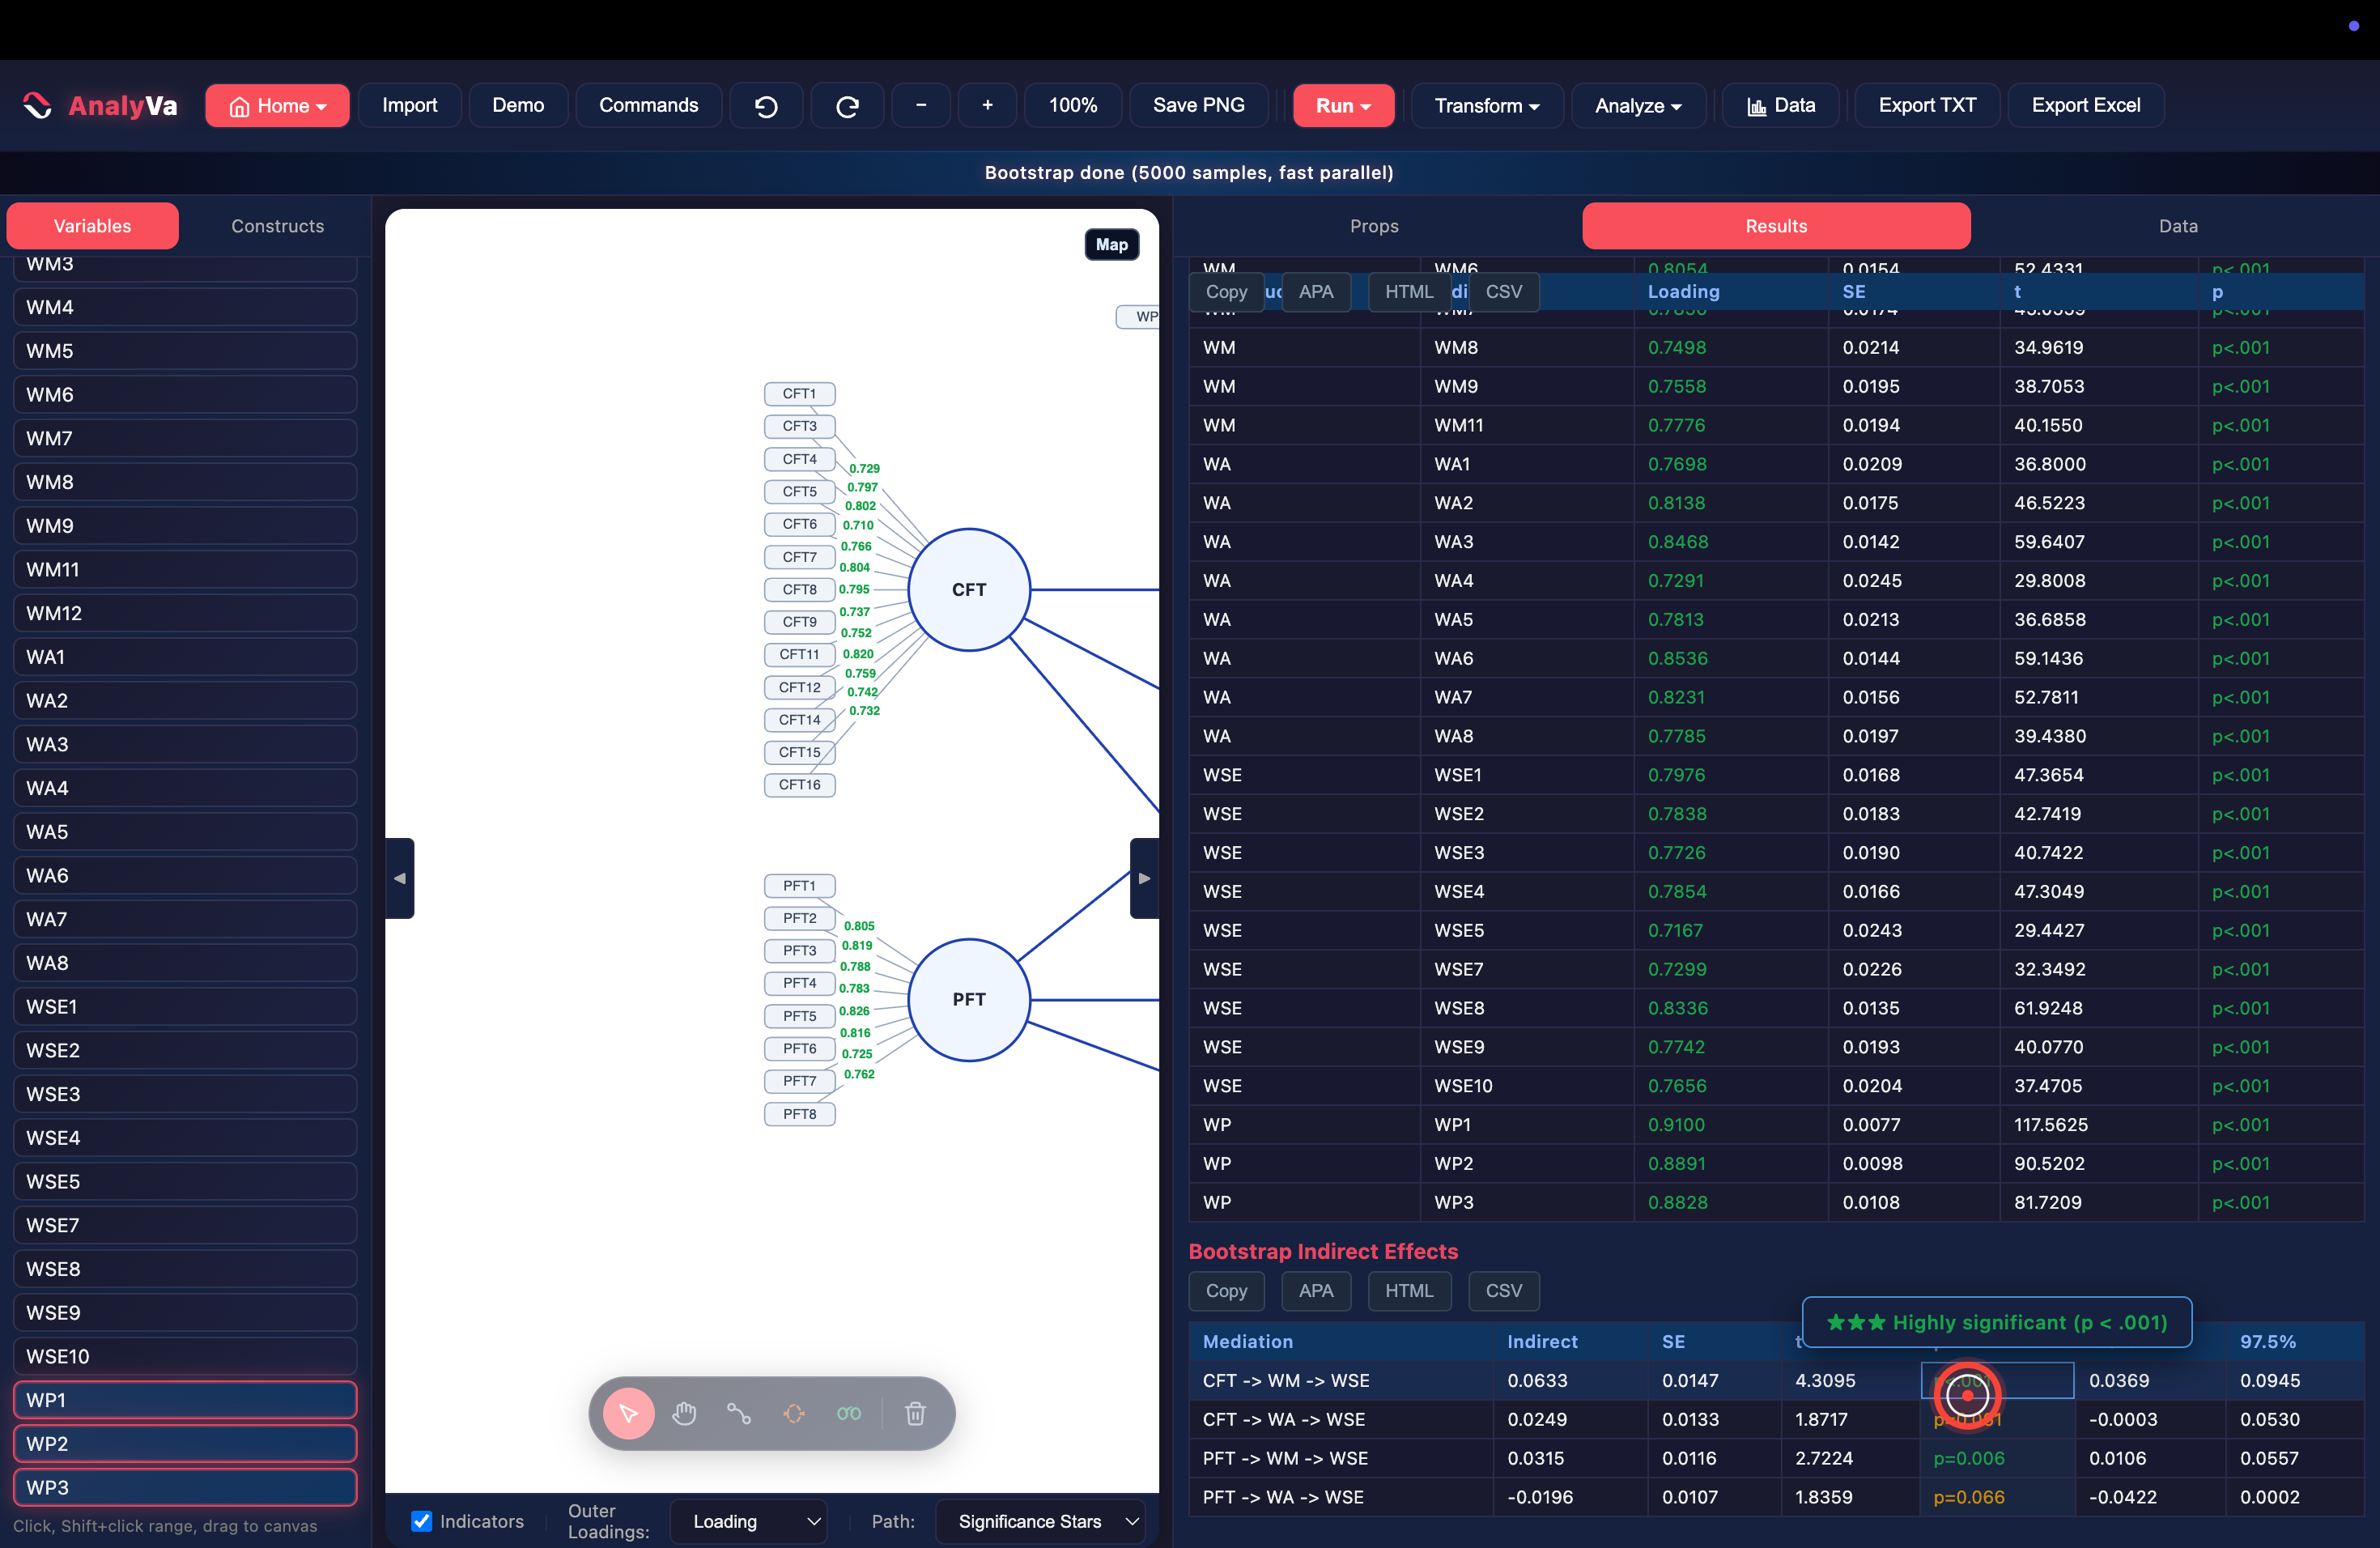
Step 17 — Check Bootstrap Indirect Effects for mediation. Because CFT and PFT both route through WM and WA on their way to WSE, AnalyVa also reports the indirect (mediated) effect for each path — CFT → WM → WSE, CFT → WA → WSE, PFT → WM → WSE, PFT → WA → WSE — with its own confidence interval. This comes free in the same run; no separate mediation analysis needed.
What to report
A null moderation result is still a result. The write-up here would state: R² for WSE improved marginally with the moderator added (0.335 → 0.366), but all four interaction terms were non-significant under 5,000-sample bootstrapping (p > 0.10 in every case), so the hypothesis that WP moderates these relationships is not supported in this sample. That’s a defensible, complete finding — and every number needed to write it came out of a single PLS-SEM run plus one bootstrap pass.