A PLS-SEM model rarely comes out clean on the first run. Somewhere in a 16-item construct there’s an indicator with a 0.68 loading that a reviewer will flag, and finding it by scanning a results table is slow. This post walks through building a four-construct model in AnalyVa, running the algorithm, and using the loadings display — plus the built-in model-health diagnostics — to find and drop the weak indicators without leaving the canvas.
Importing the data
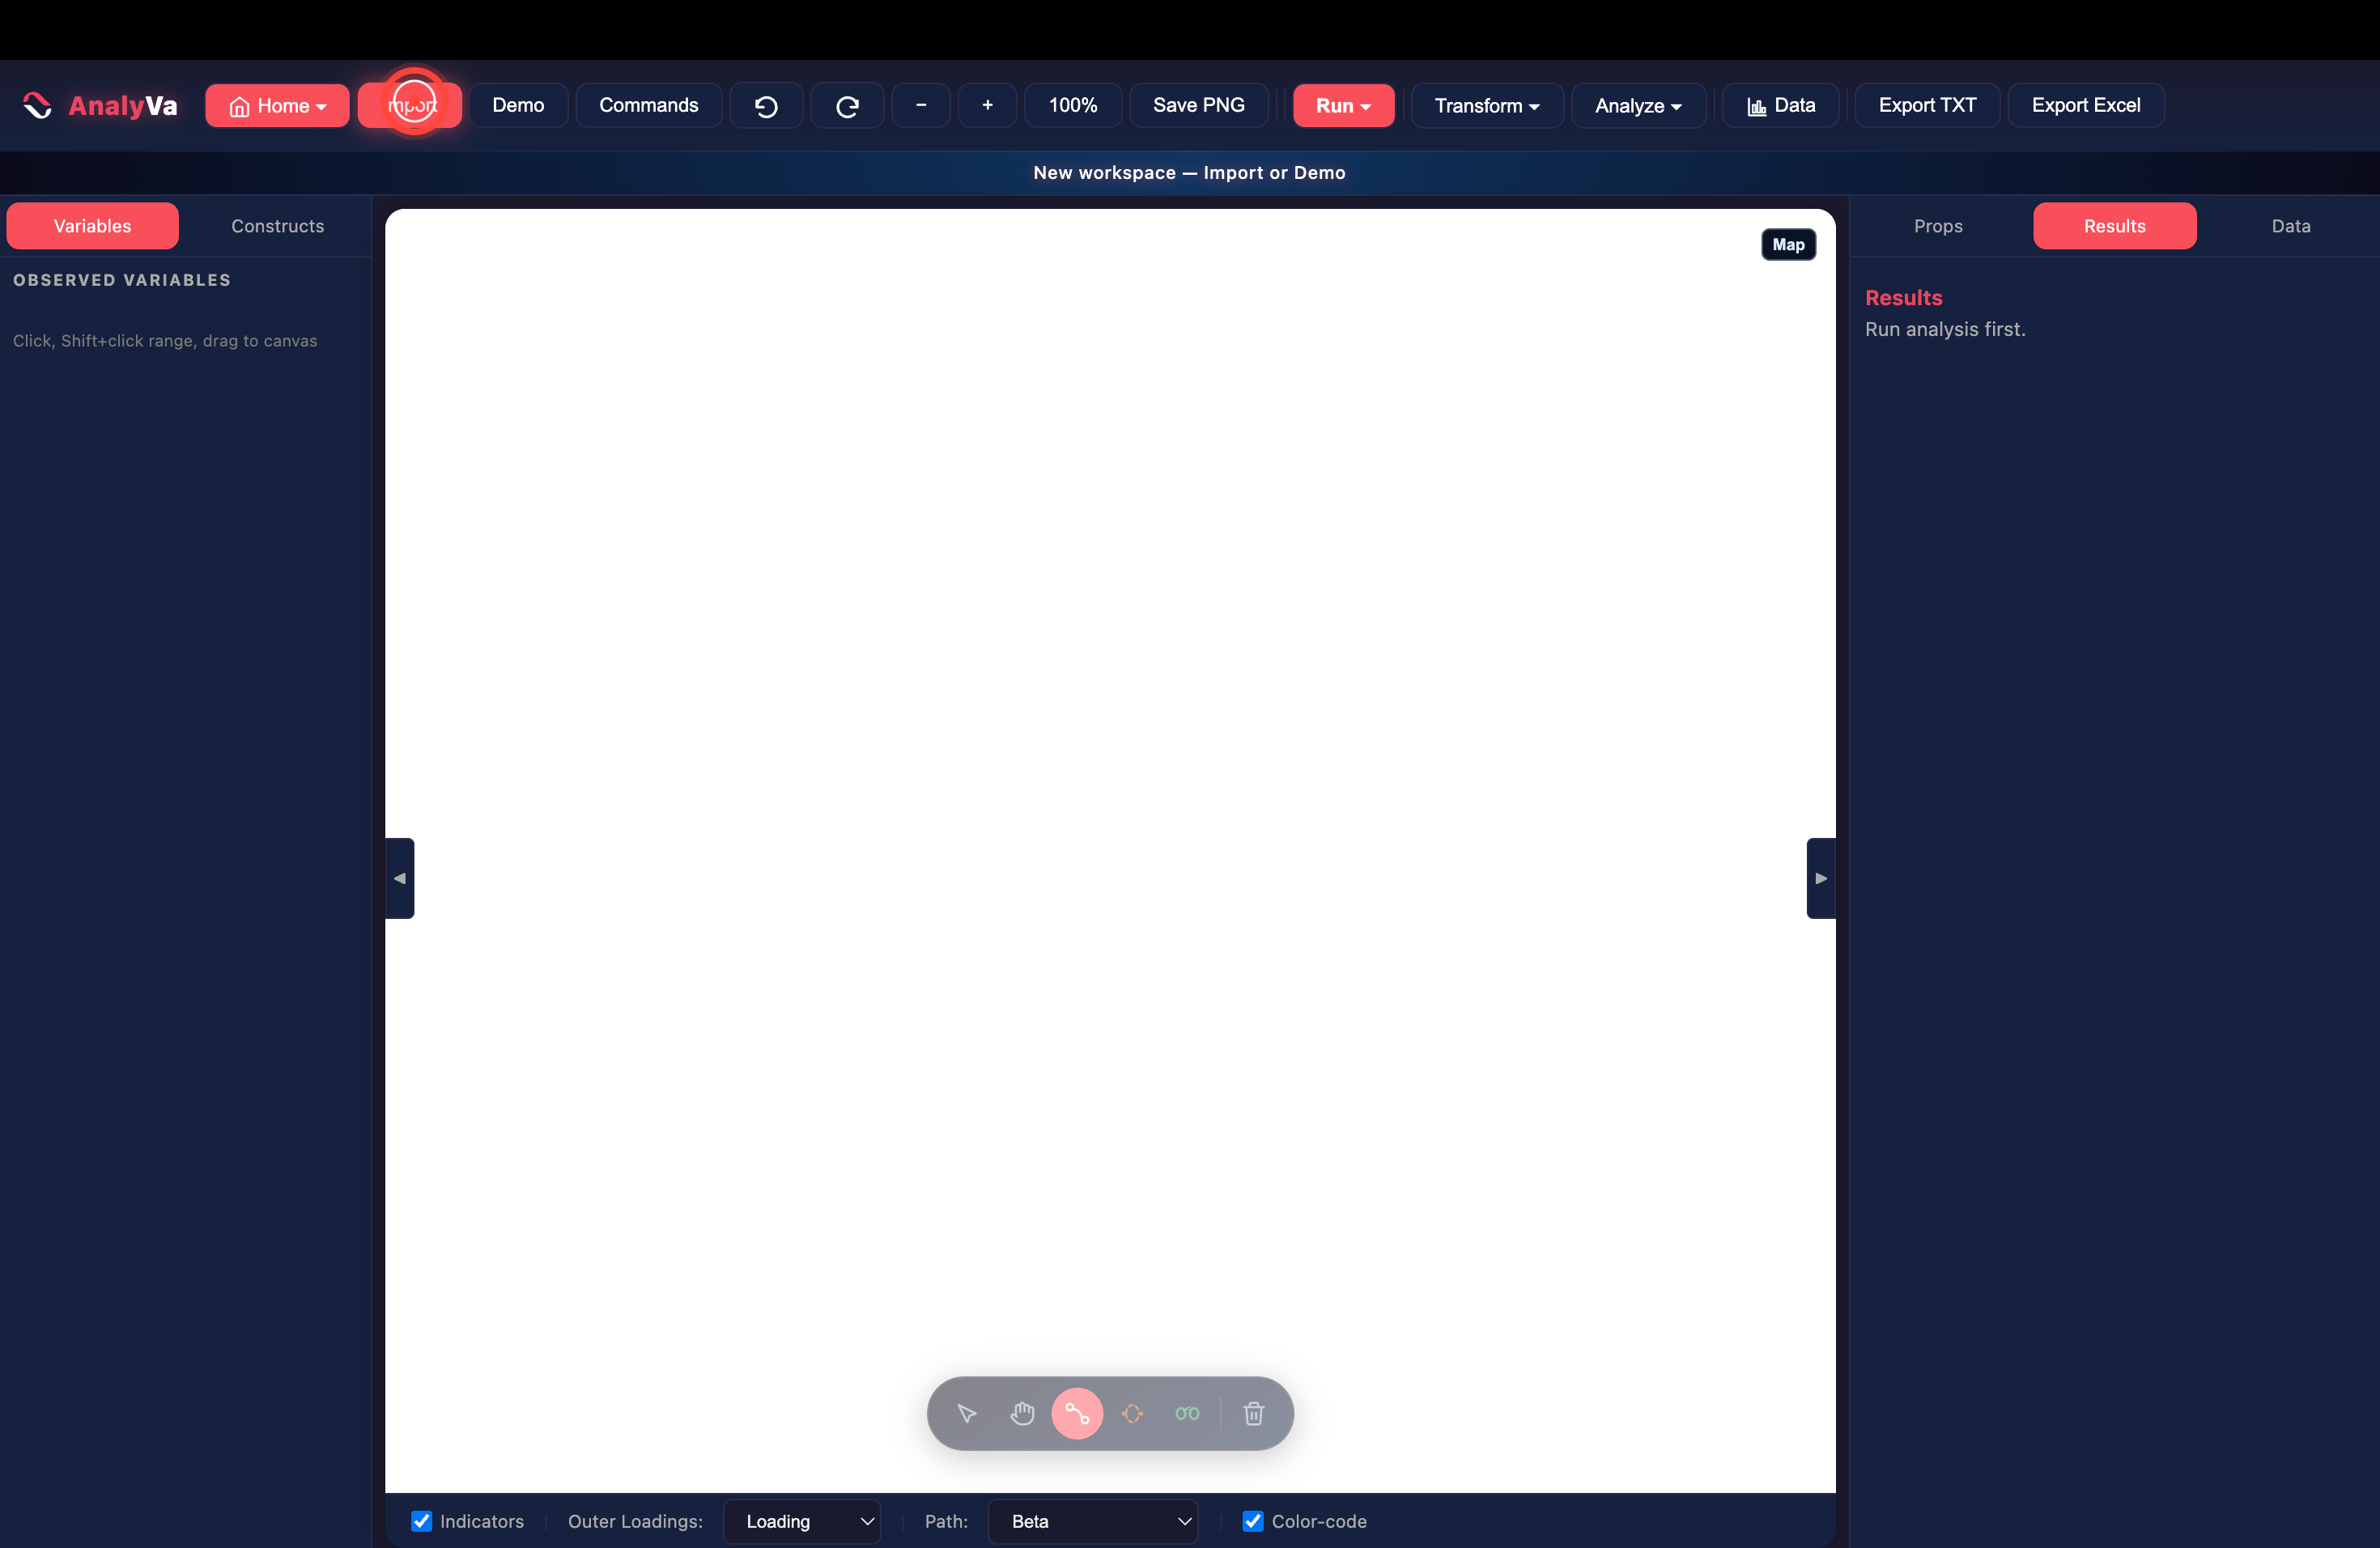
Step 1 — Click Import. On a fresh workspace, the canvas is empty and the Results panel just says “Run analysis first.” Click Import in the top toolbar.
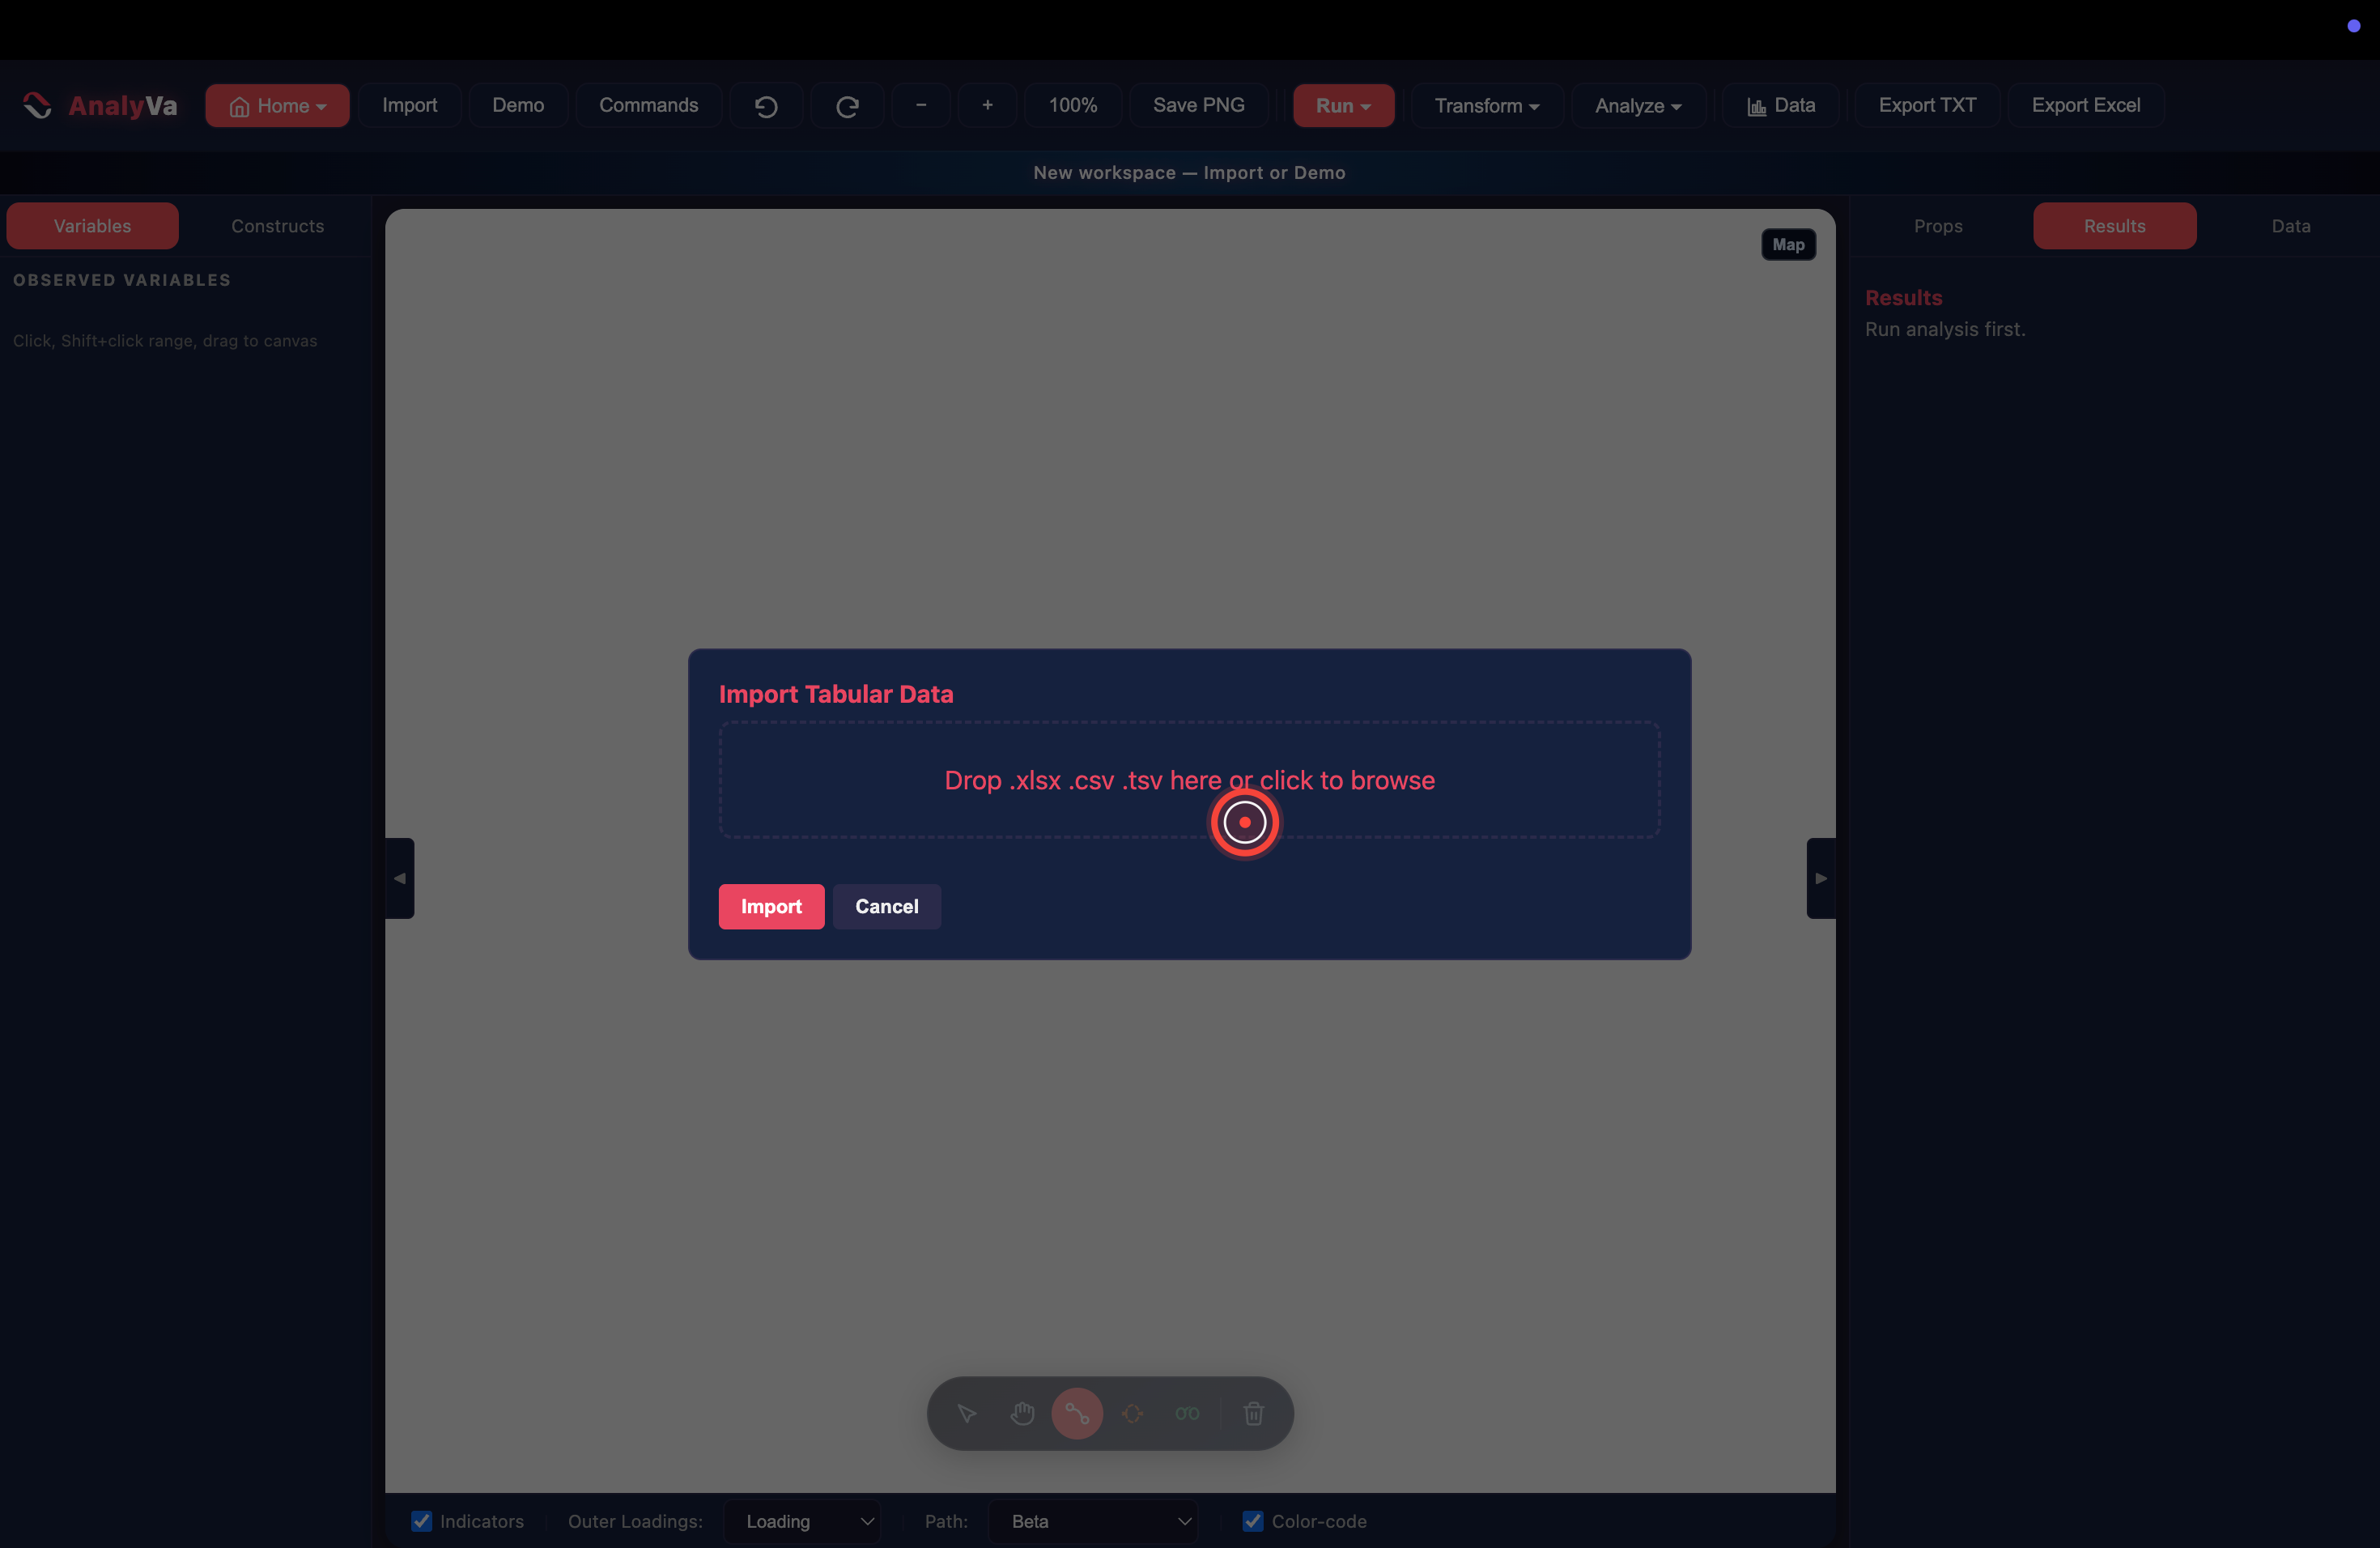
Step 2 — Drop the file.
The Import Tabular Data dialog accepts .xlsx, .csv, or .tsv.
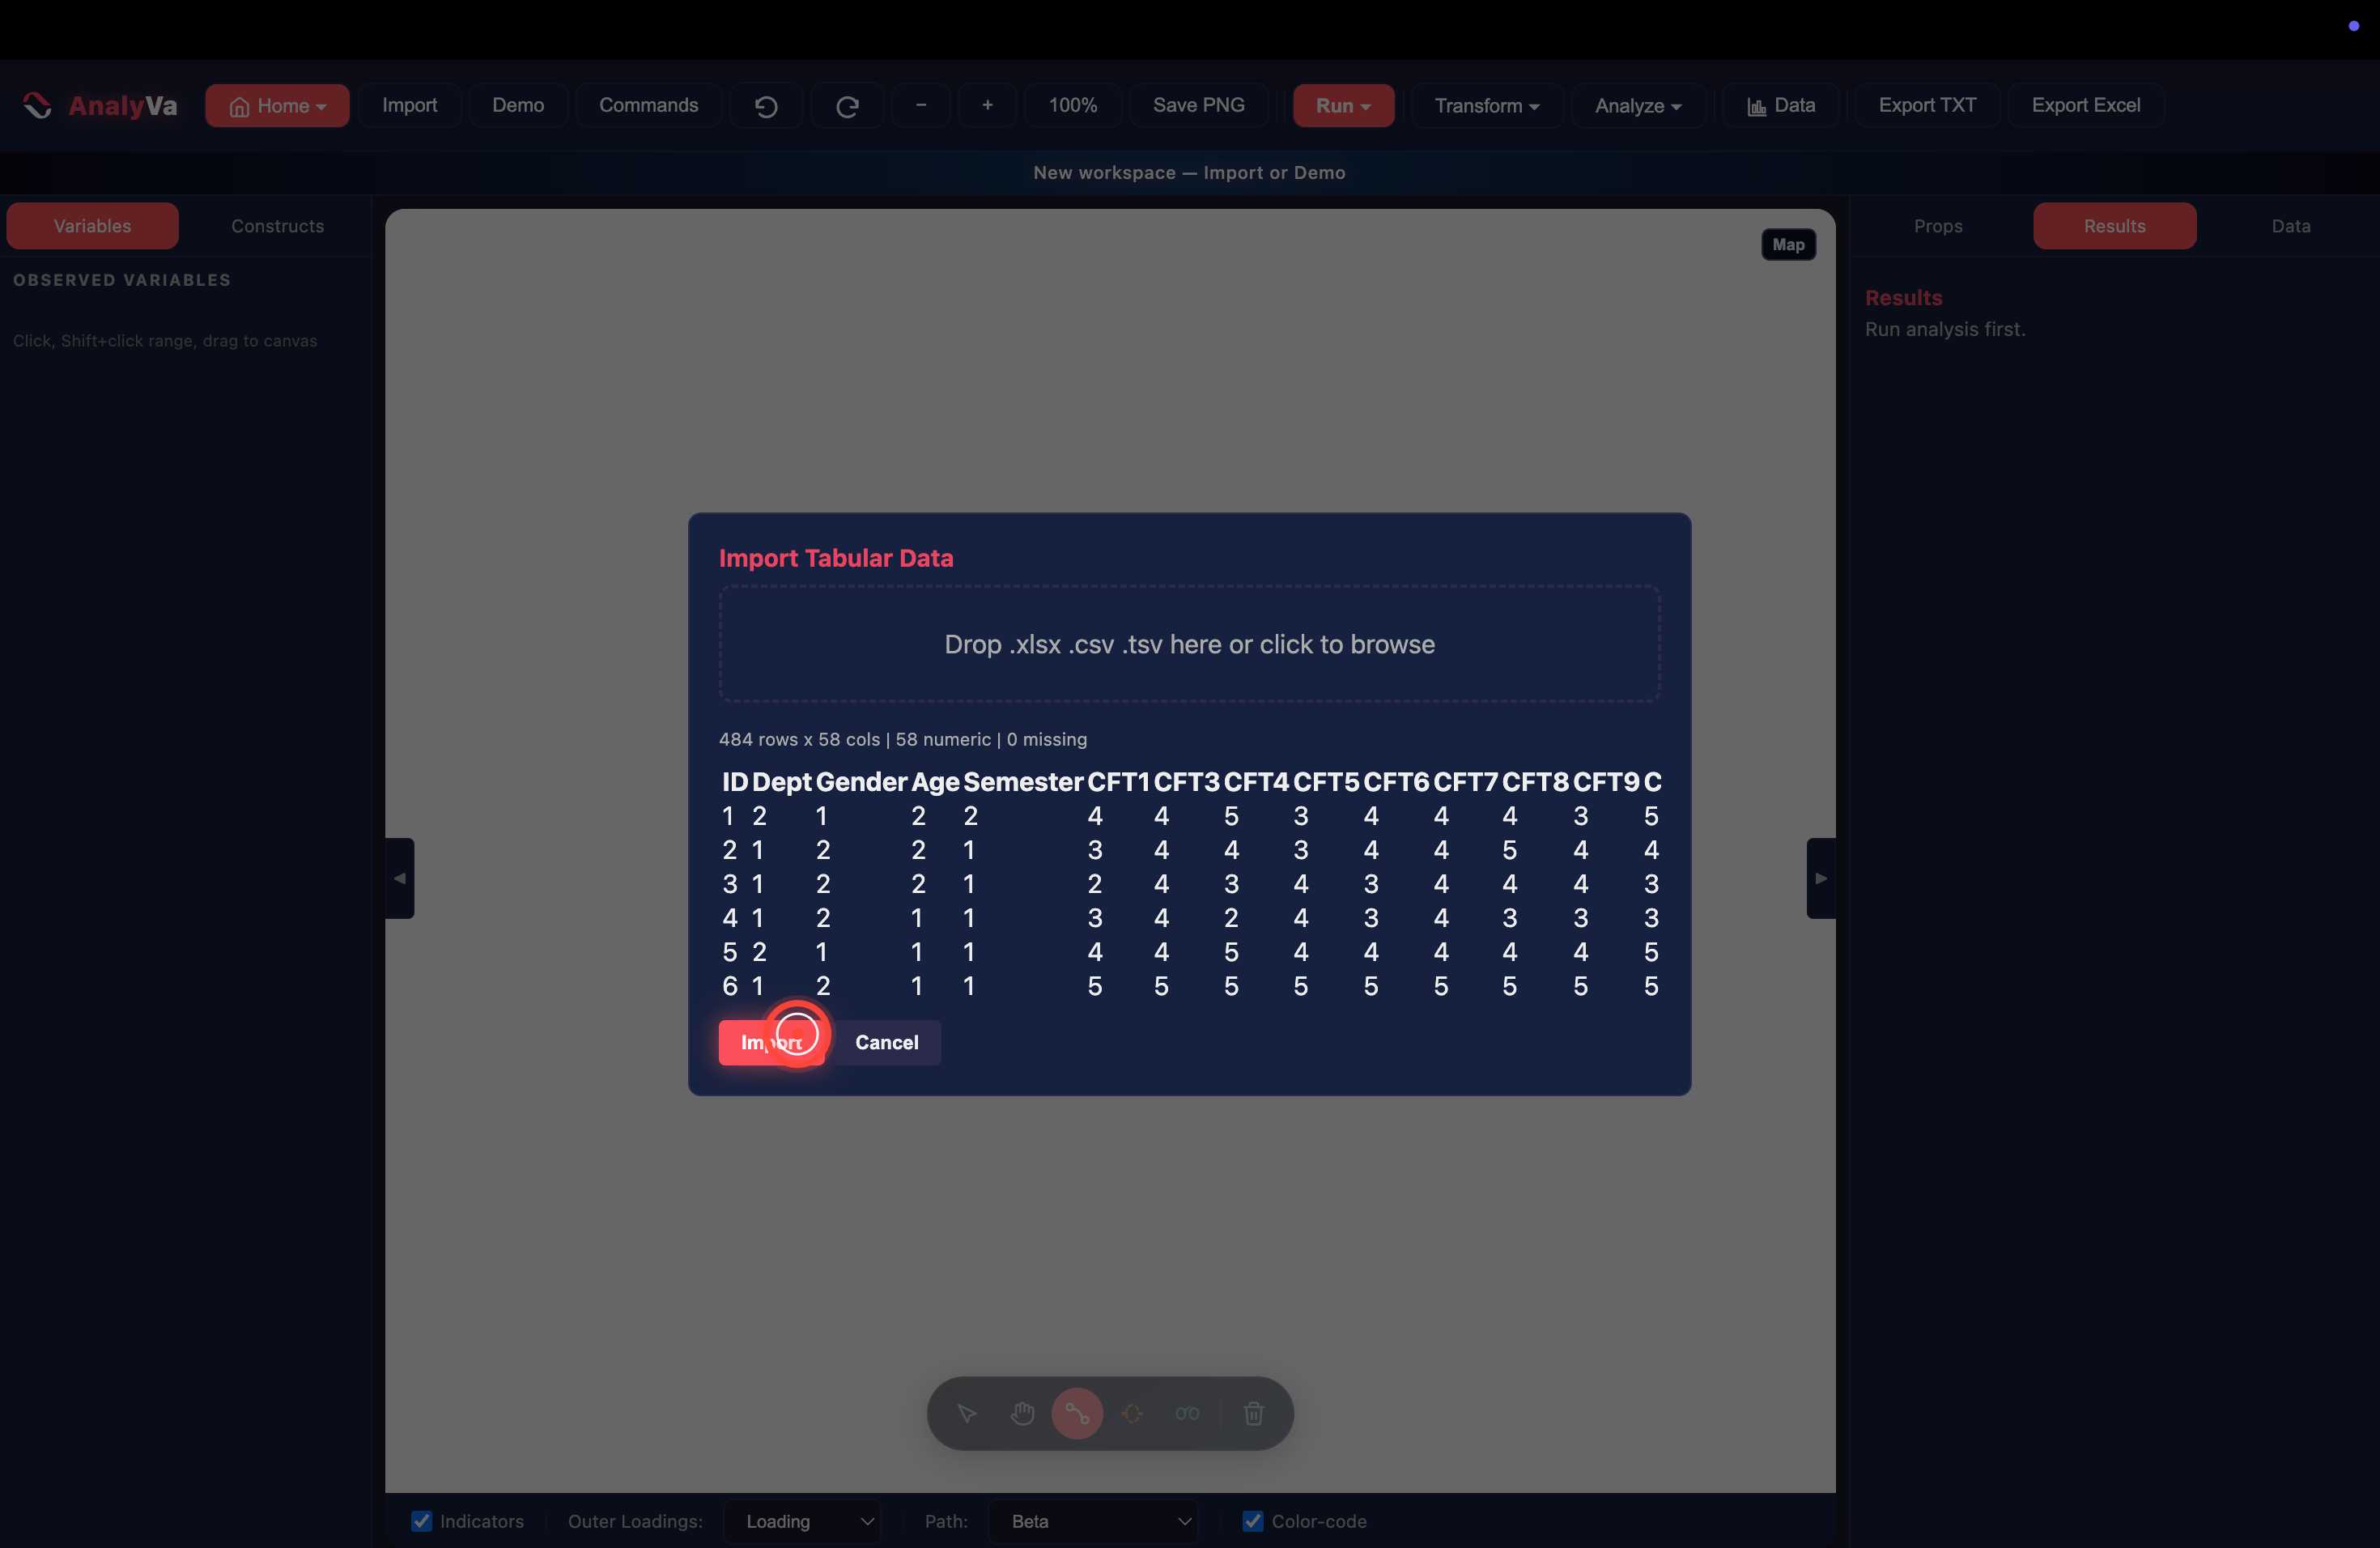
Step 3 — Check the preview and import. AnalyVa parses the file and reports the shape before you commit — here, 484 rows × 58 columns, all numeric, no missing values. The first six rows are shown for a sanity check. Click Import.
Building a four-construct model
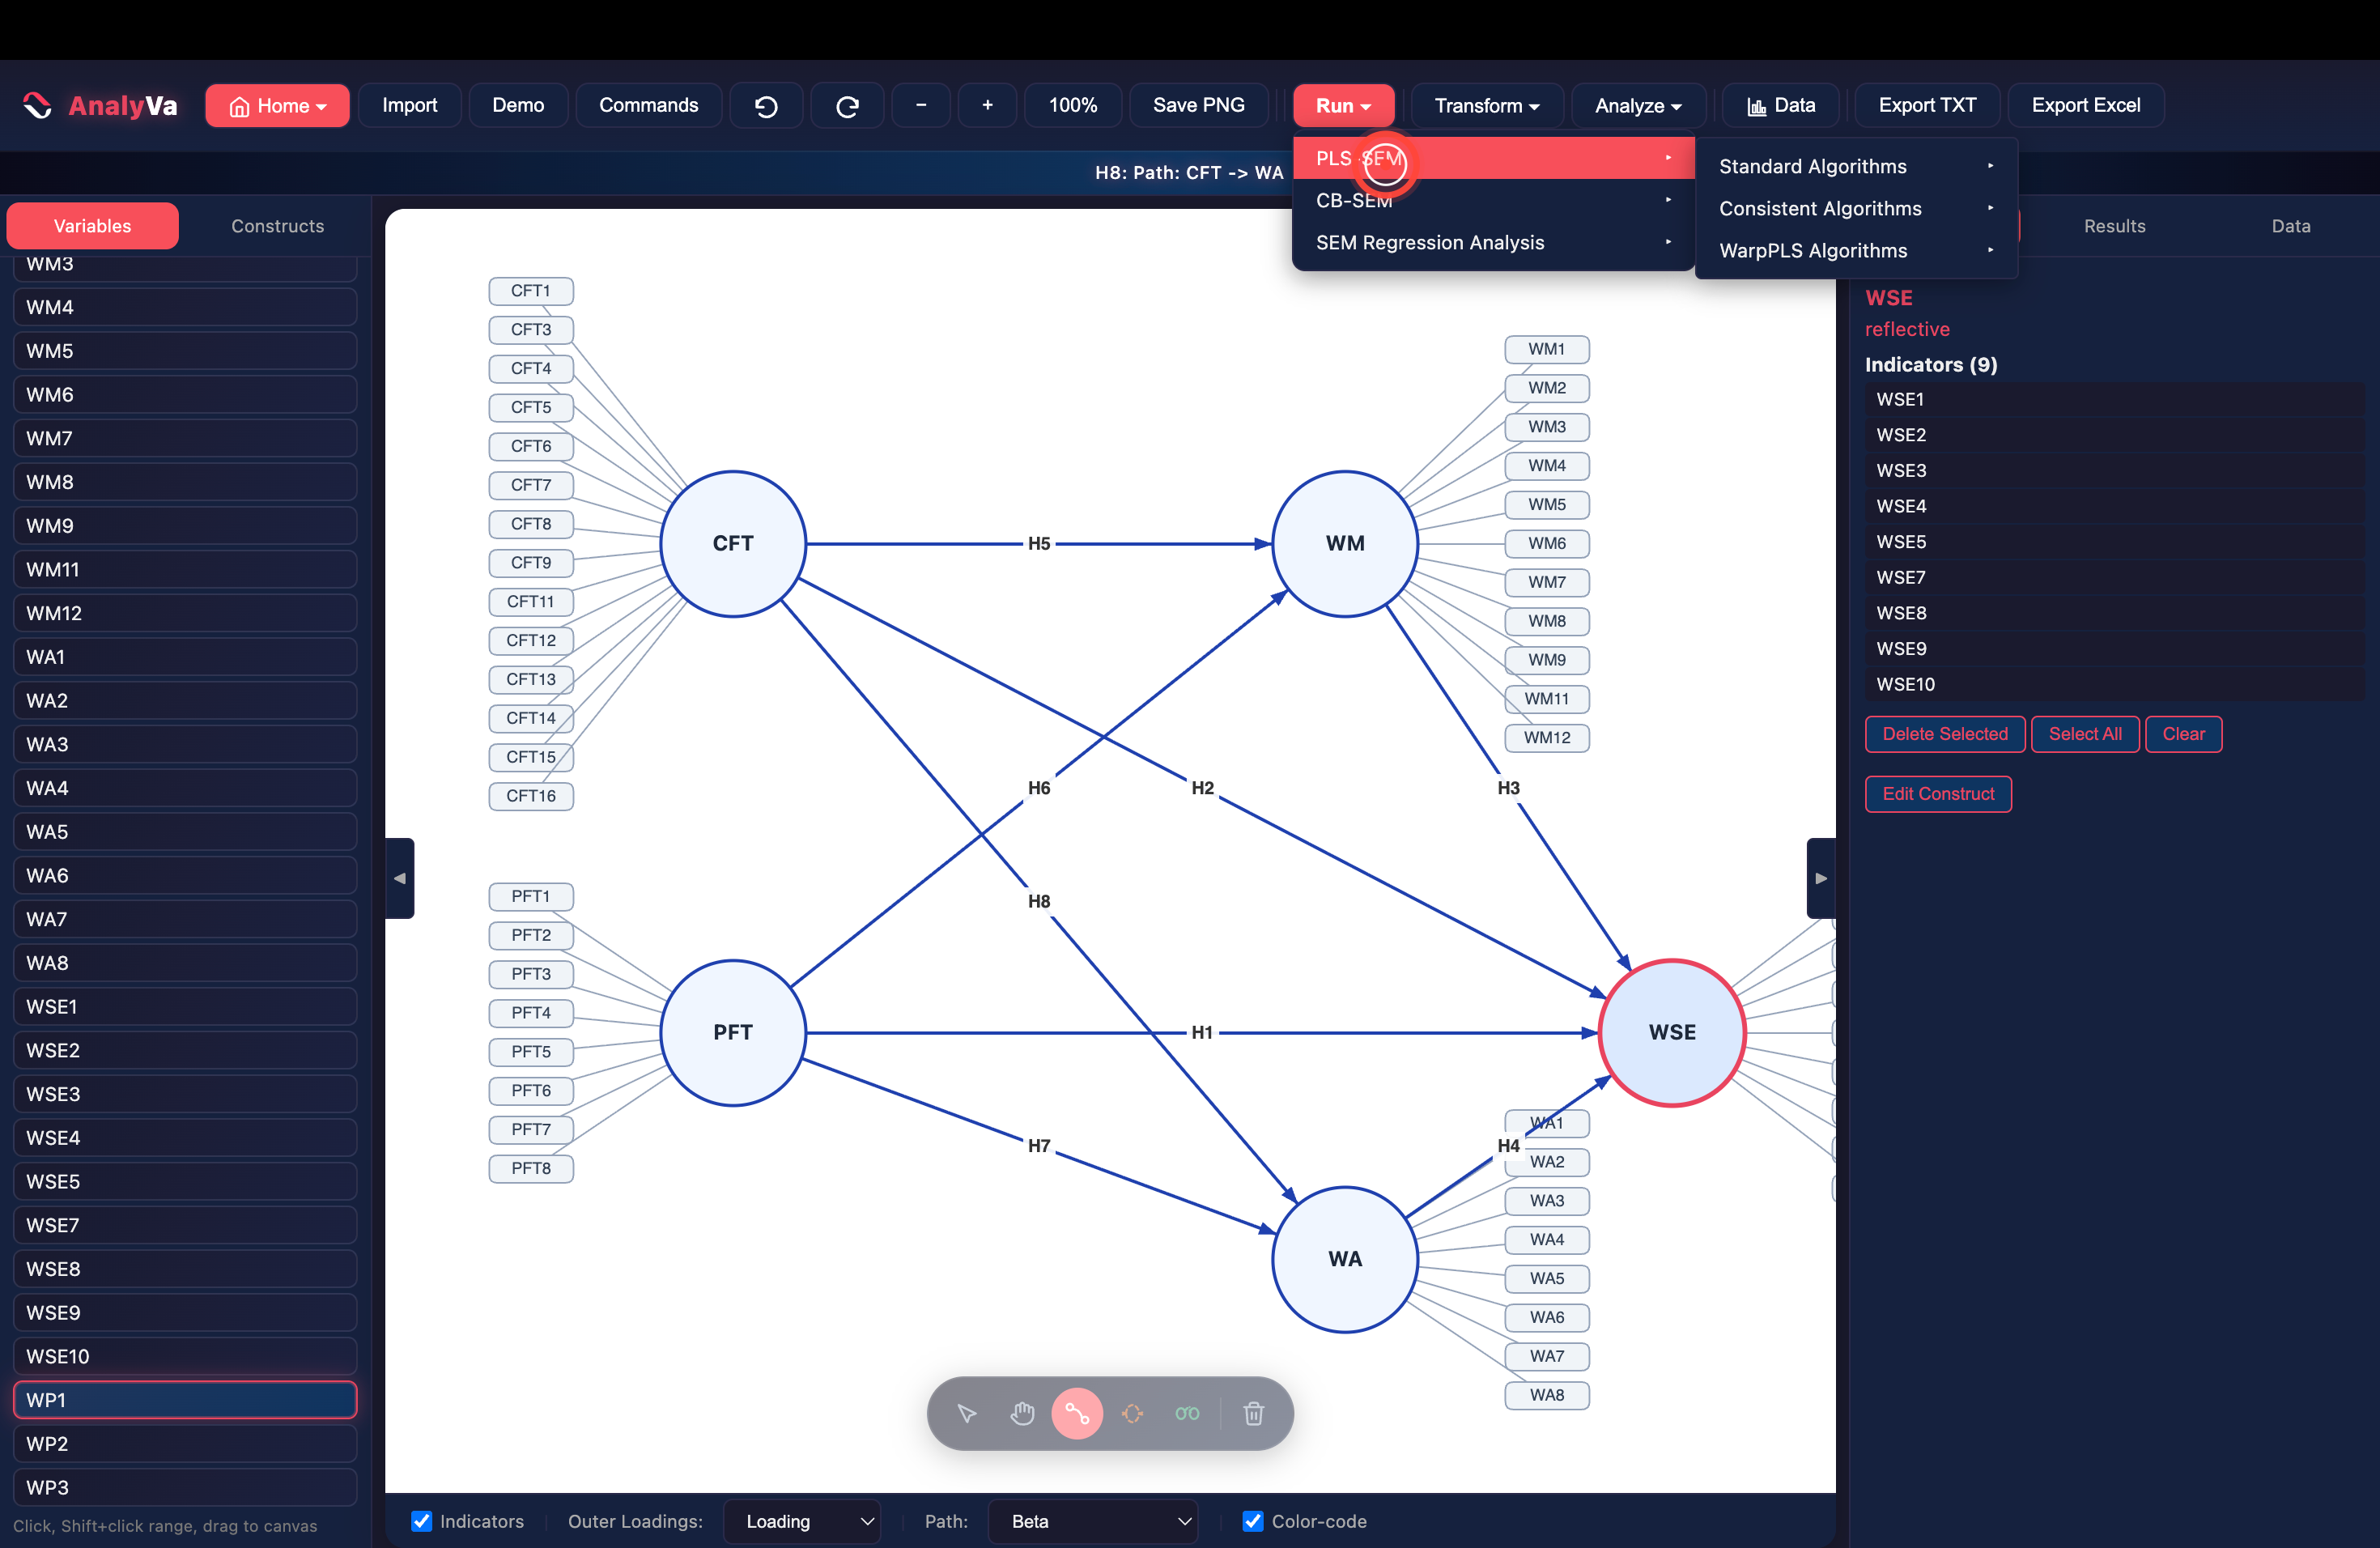
The dataset holds four independent constructs — CFT, PFT, WM, and WA — all predicting a single outcome, WSE. Building each construct is the same click-shift-click-drag pattern used throughout AnalyVa: click an indicator’s first item in the sidebar, shift-click the last, and drag the highlighted range onto the canvas. Repeat for each block, then switch to the Path tool and draw a connection between every predictor and WSE.
Step 4 — The full model with all eight hypothesis paths. CFT and PFT each predict WM and WA directly, and all four predict WSE — eight paths in total (H1–H8). Clicking the WSE construct switches the right panel to Props, listing all 9 of its indicators along with Delete Selected, Select All, and Clear buttons — the same controls used later for indicator cleanup.
Running the algorithm
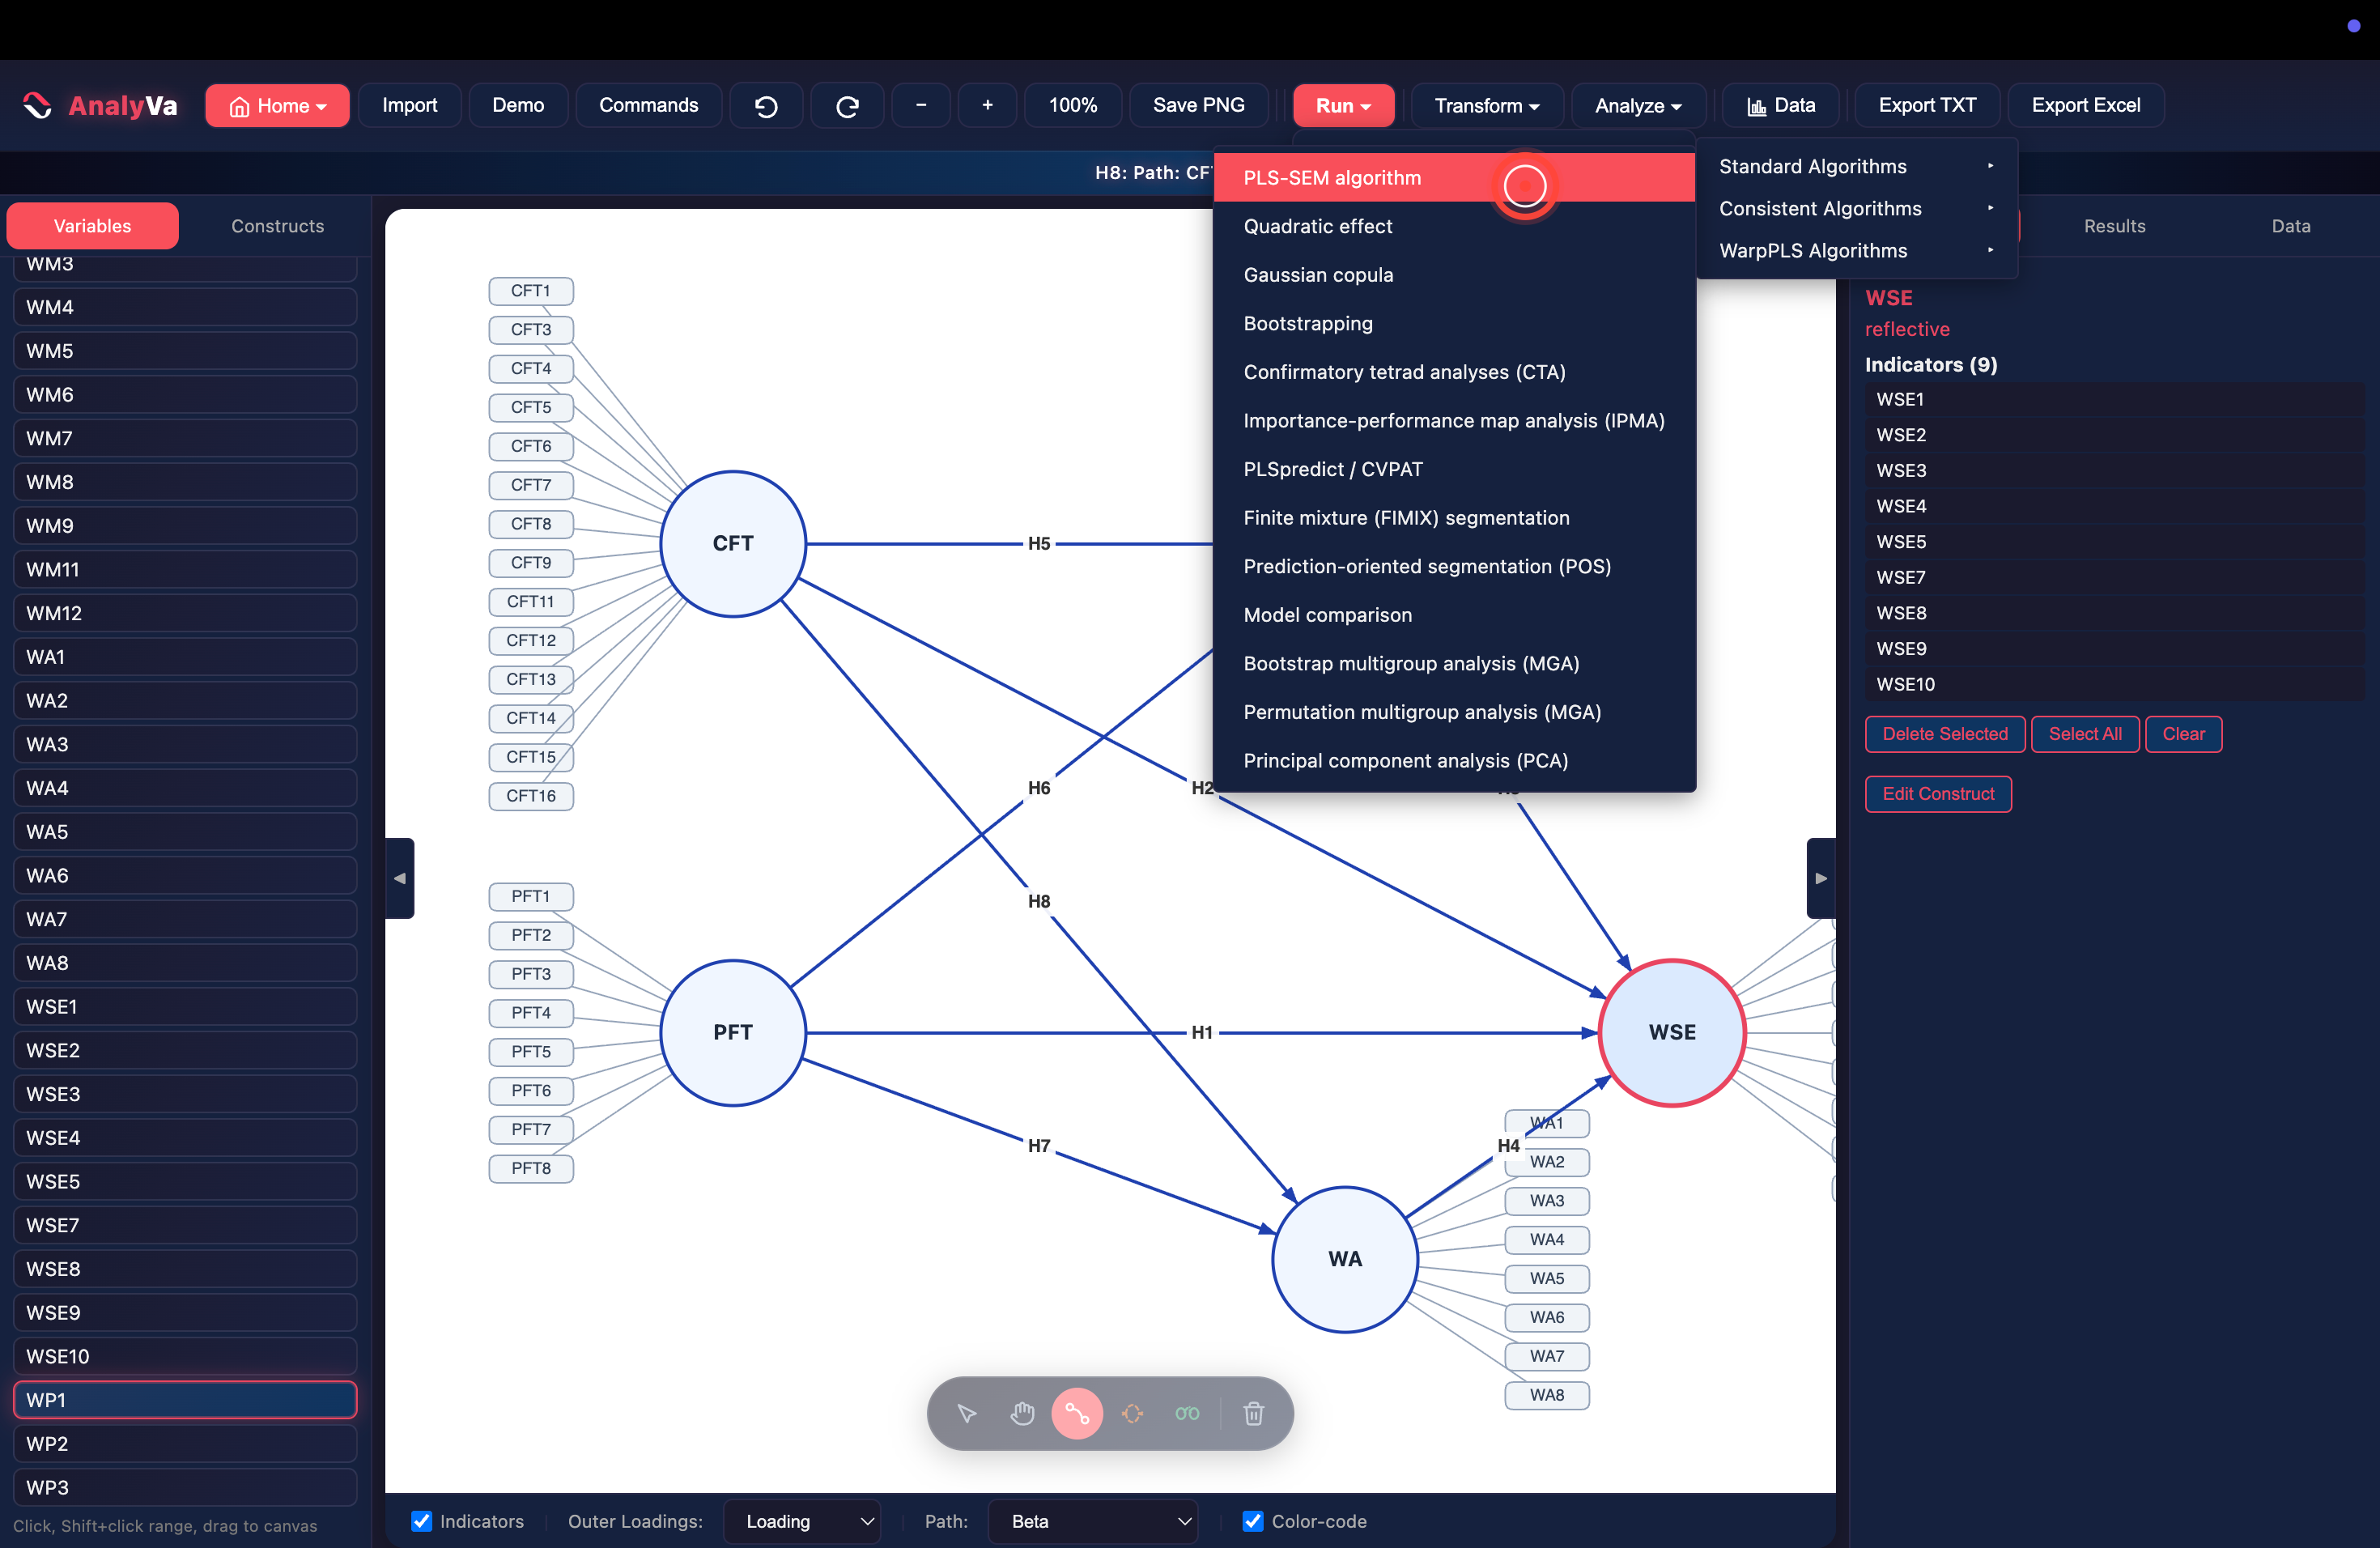
Step 5 — Open Run → PLS-SEM → Standard Algorithms → PLS-SEM algorithm.
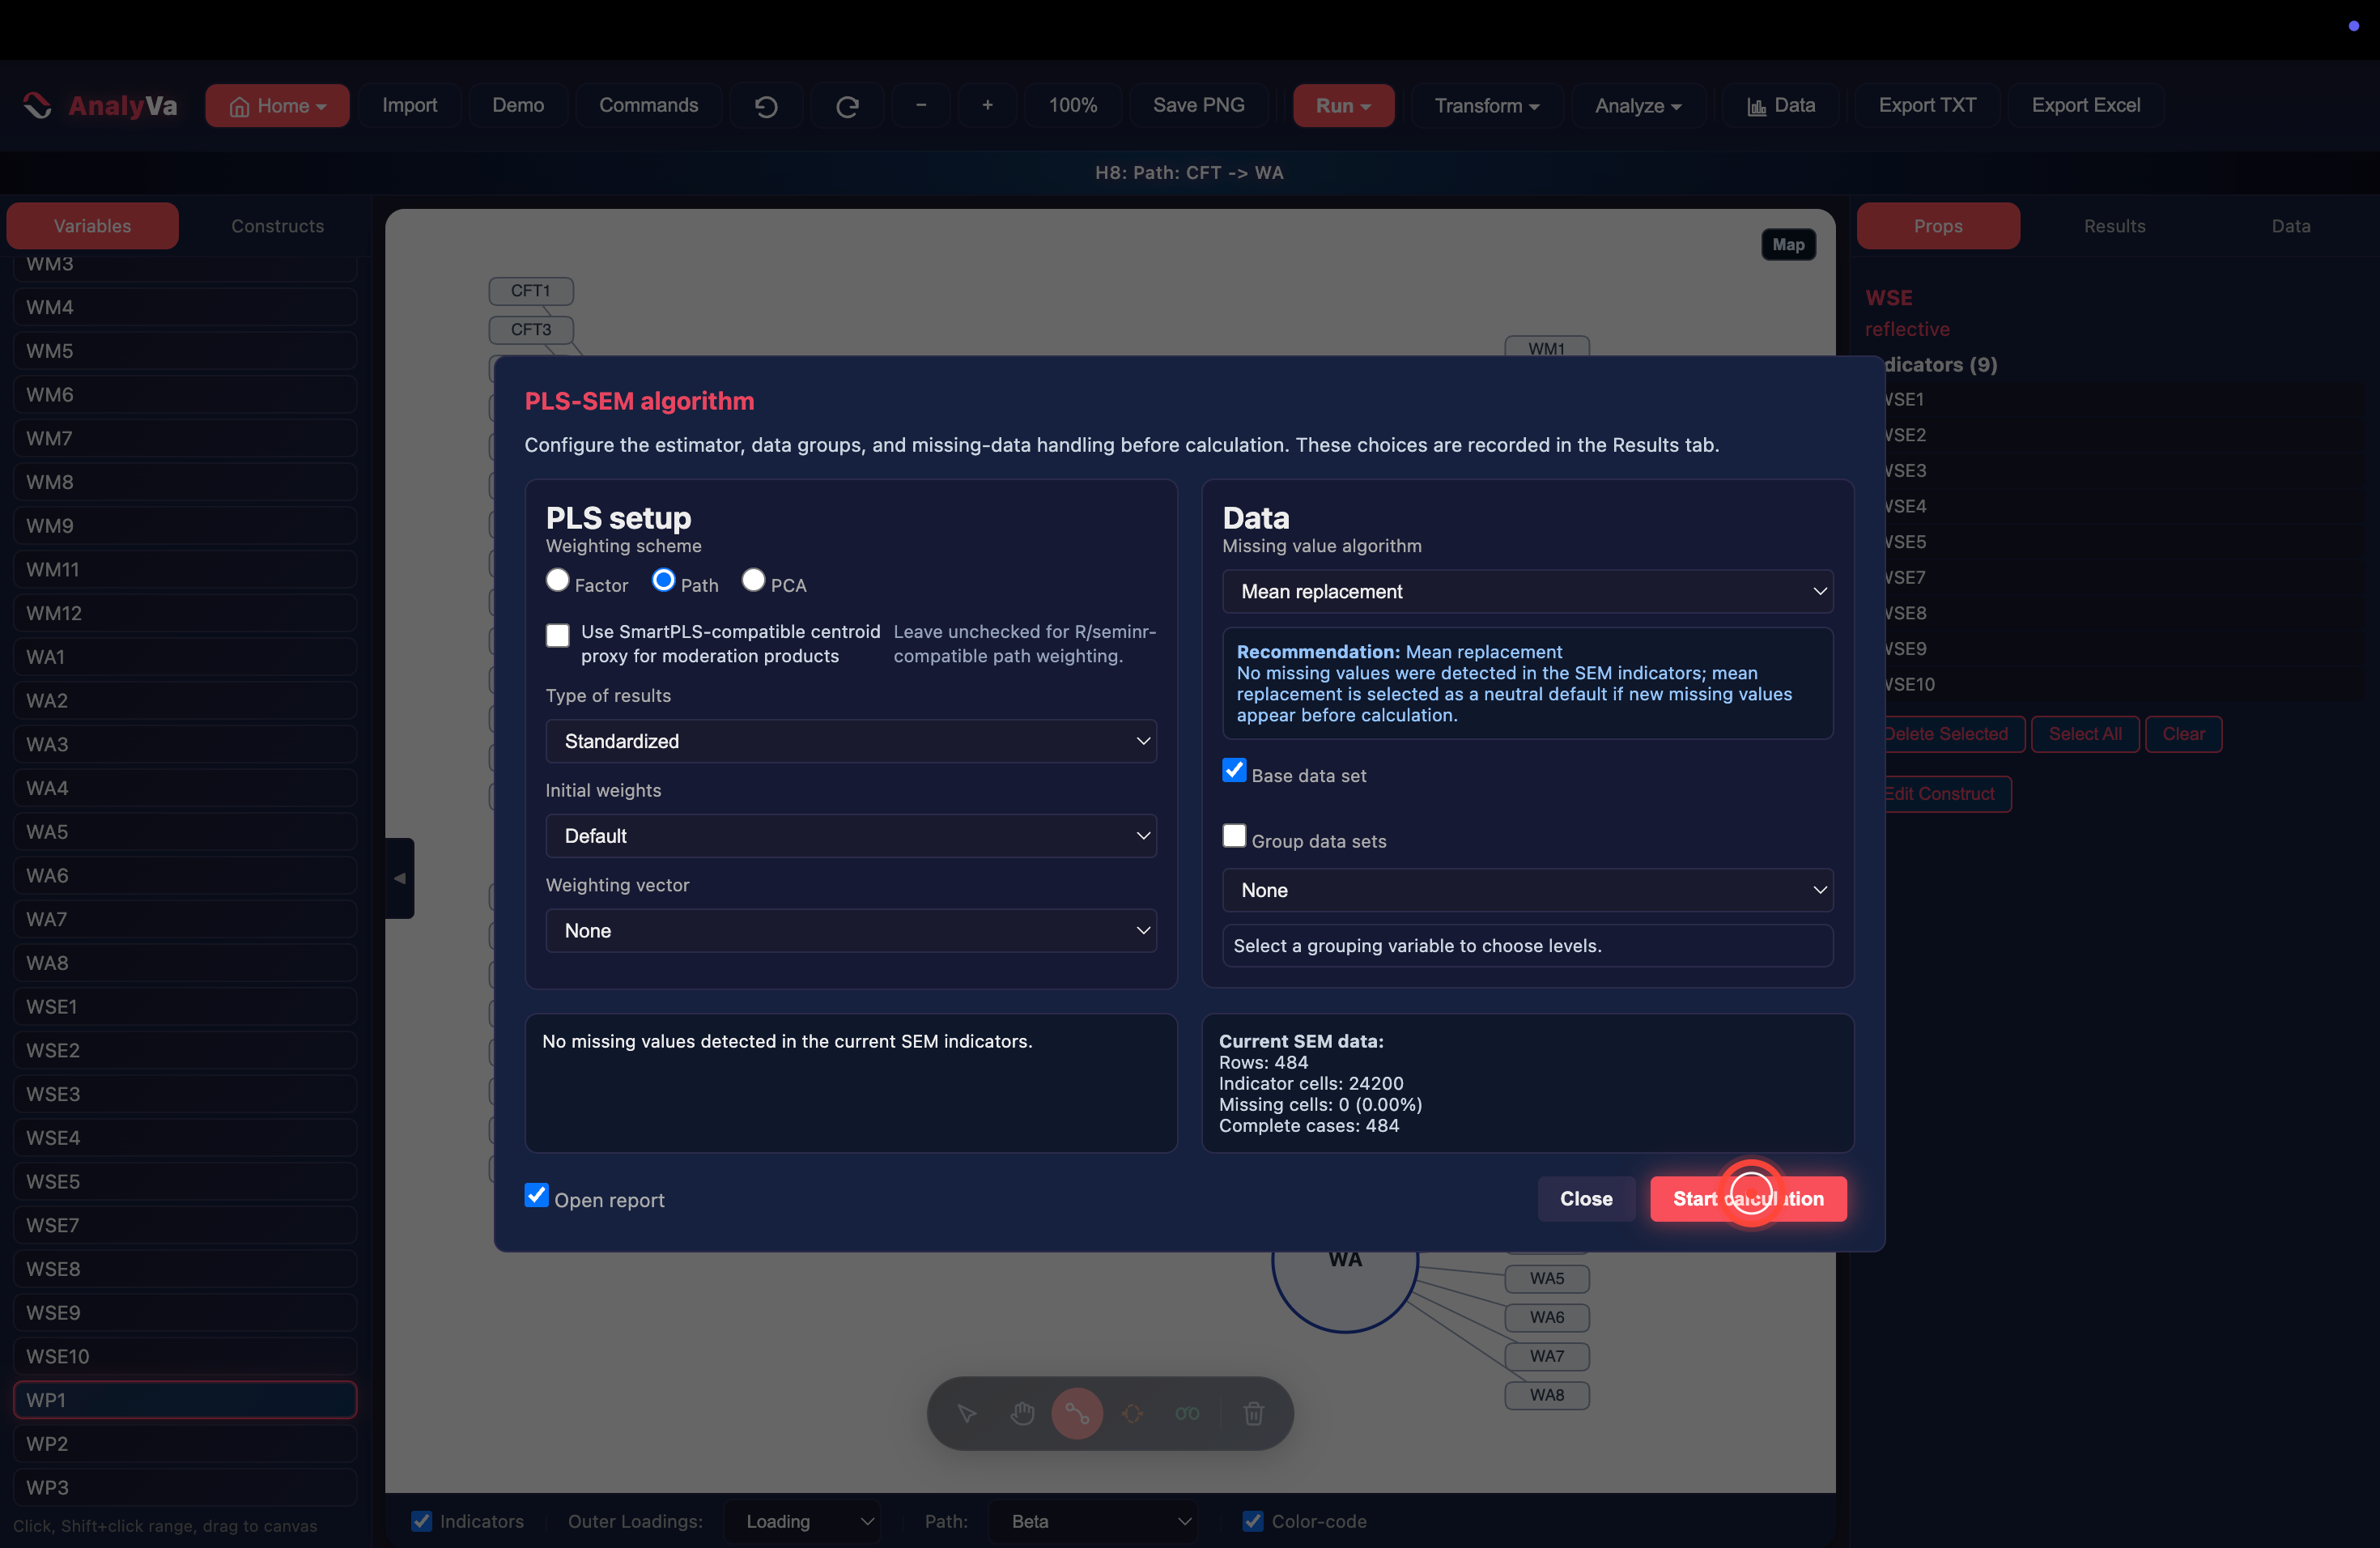
Step 6 — Configure and click Start calculation. The configuration dialog defaults to the Hair et al. recommendations: Path weighting scheme, Standardized results, Mean replacement for missing values (moot here — AnalyVa confirms zero missing cells across the 484 rows). Leave the defaults and click Start calculation.
Reading the Smart Model Health panel
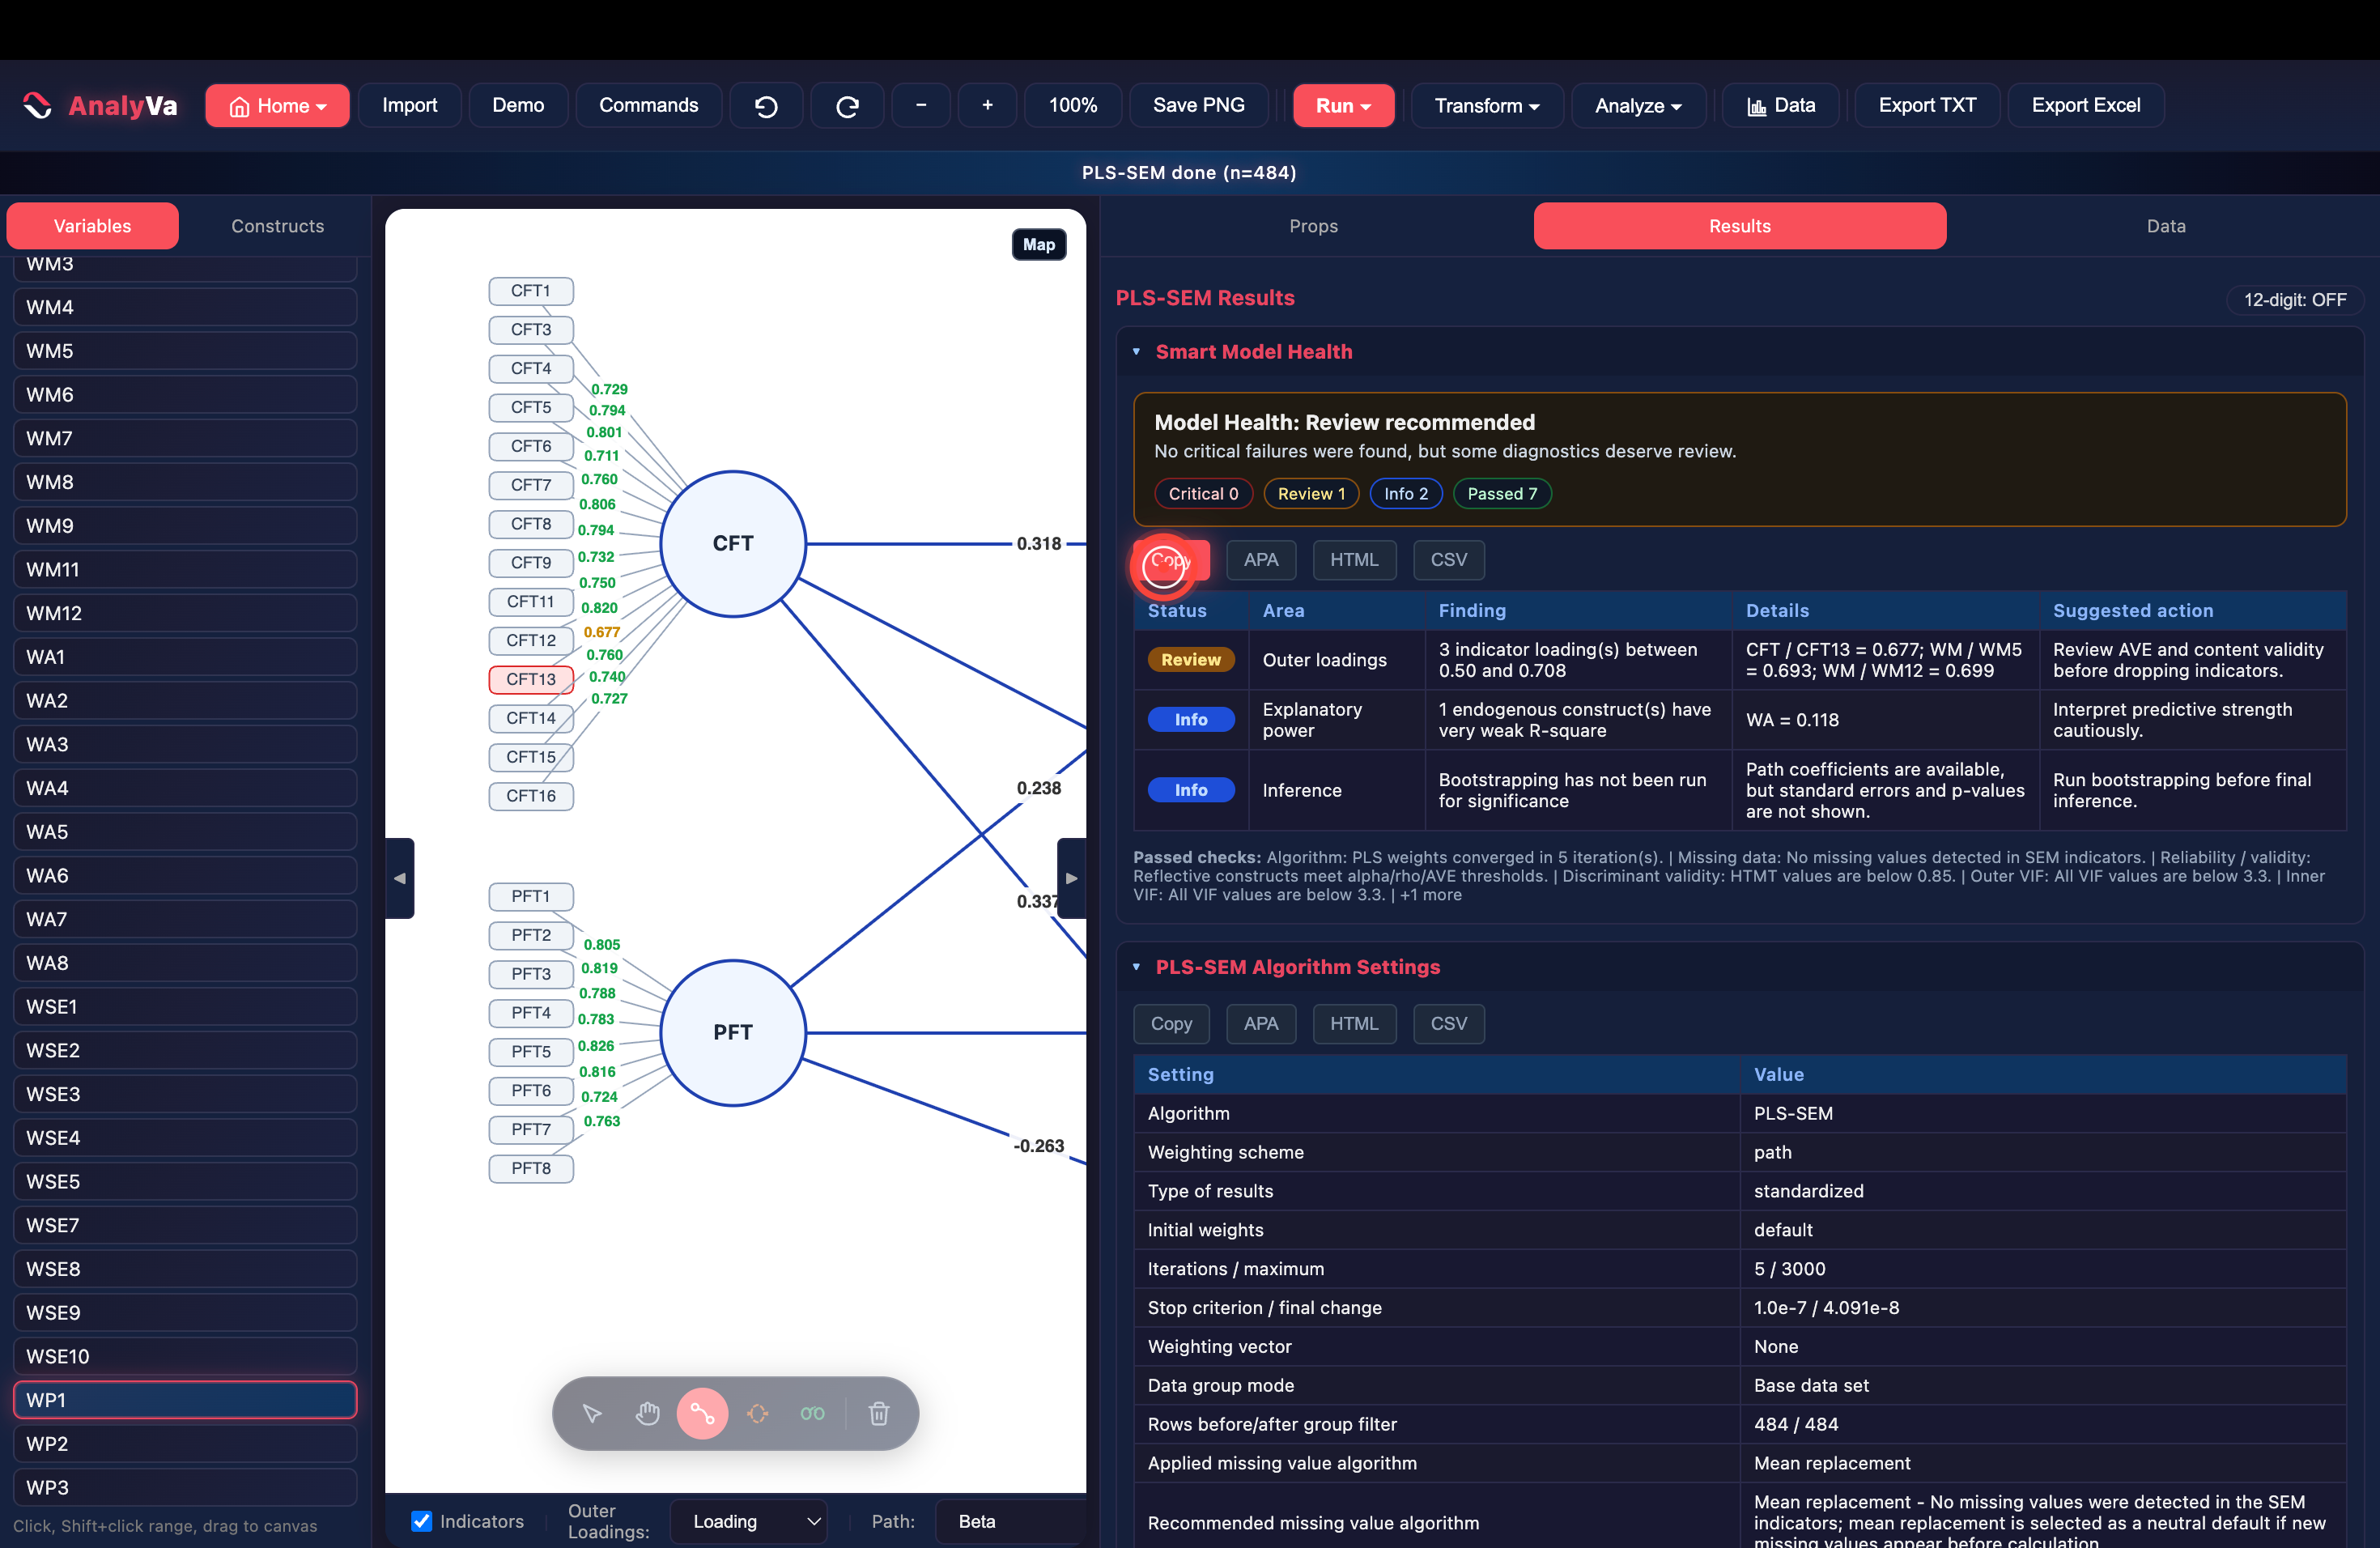
Step 7 — Check the diagnostics before touching the loadings. The Results tab opens with a Smart Model Health summary before any other output. For this run it reads “Review recommended” — no critical failures, but the checklist flags something specific:
Review — Outer loadings. 3 indicator loading(s) between 0.50 and 0.708:
CFT / CFT13 = 0.677;WM / WM5 = 0.693;WM / WM12 = 0.699. Suggested action: review AVE and content validity before dropping indicators.
That one line does the scanning work for you — no need to hunt through a loadings table for the offenders. AnalyVa also flags that WA’s R² (0.118) is weak and that bootstrapping hasn’t been run yet, both worth remembering for later.
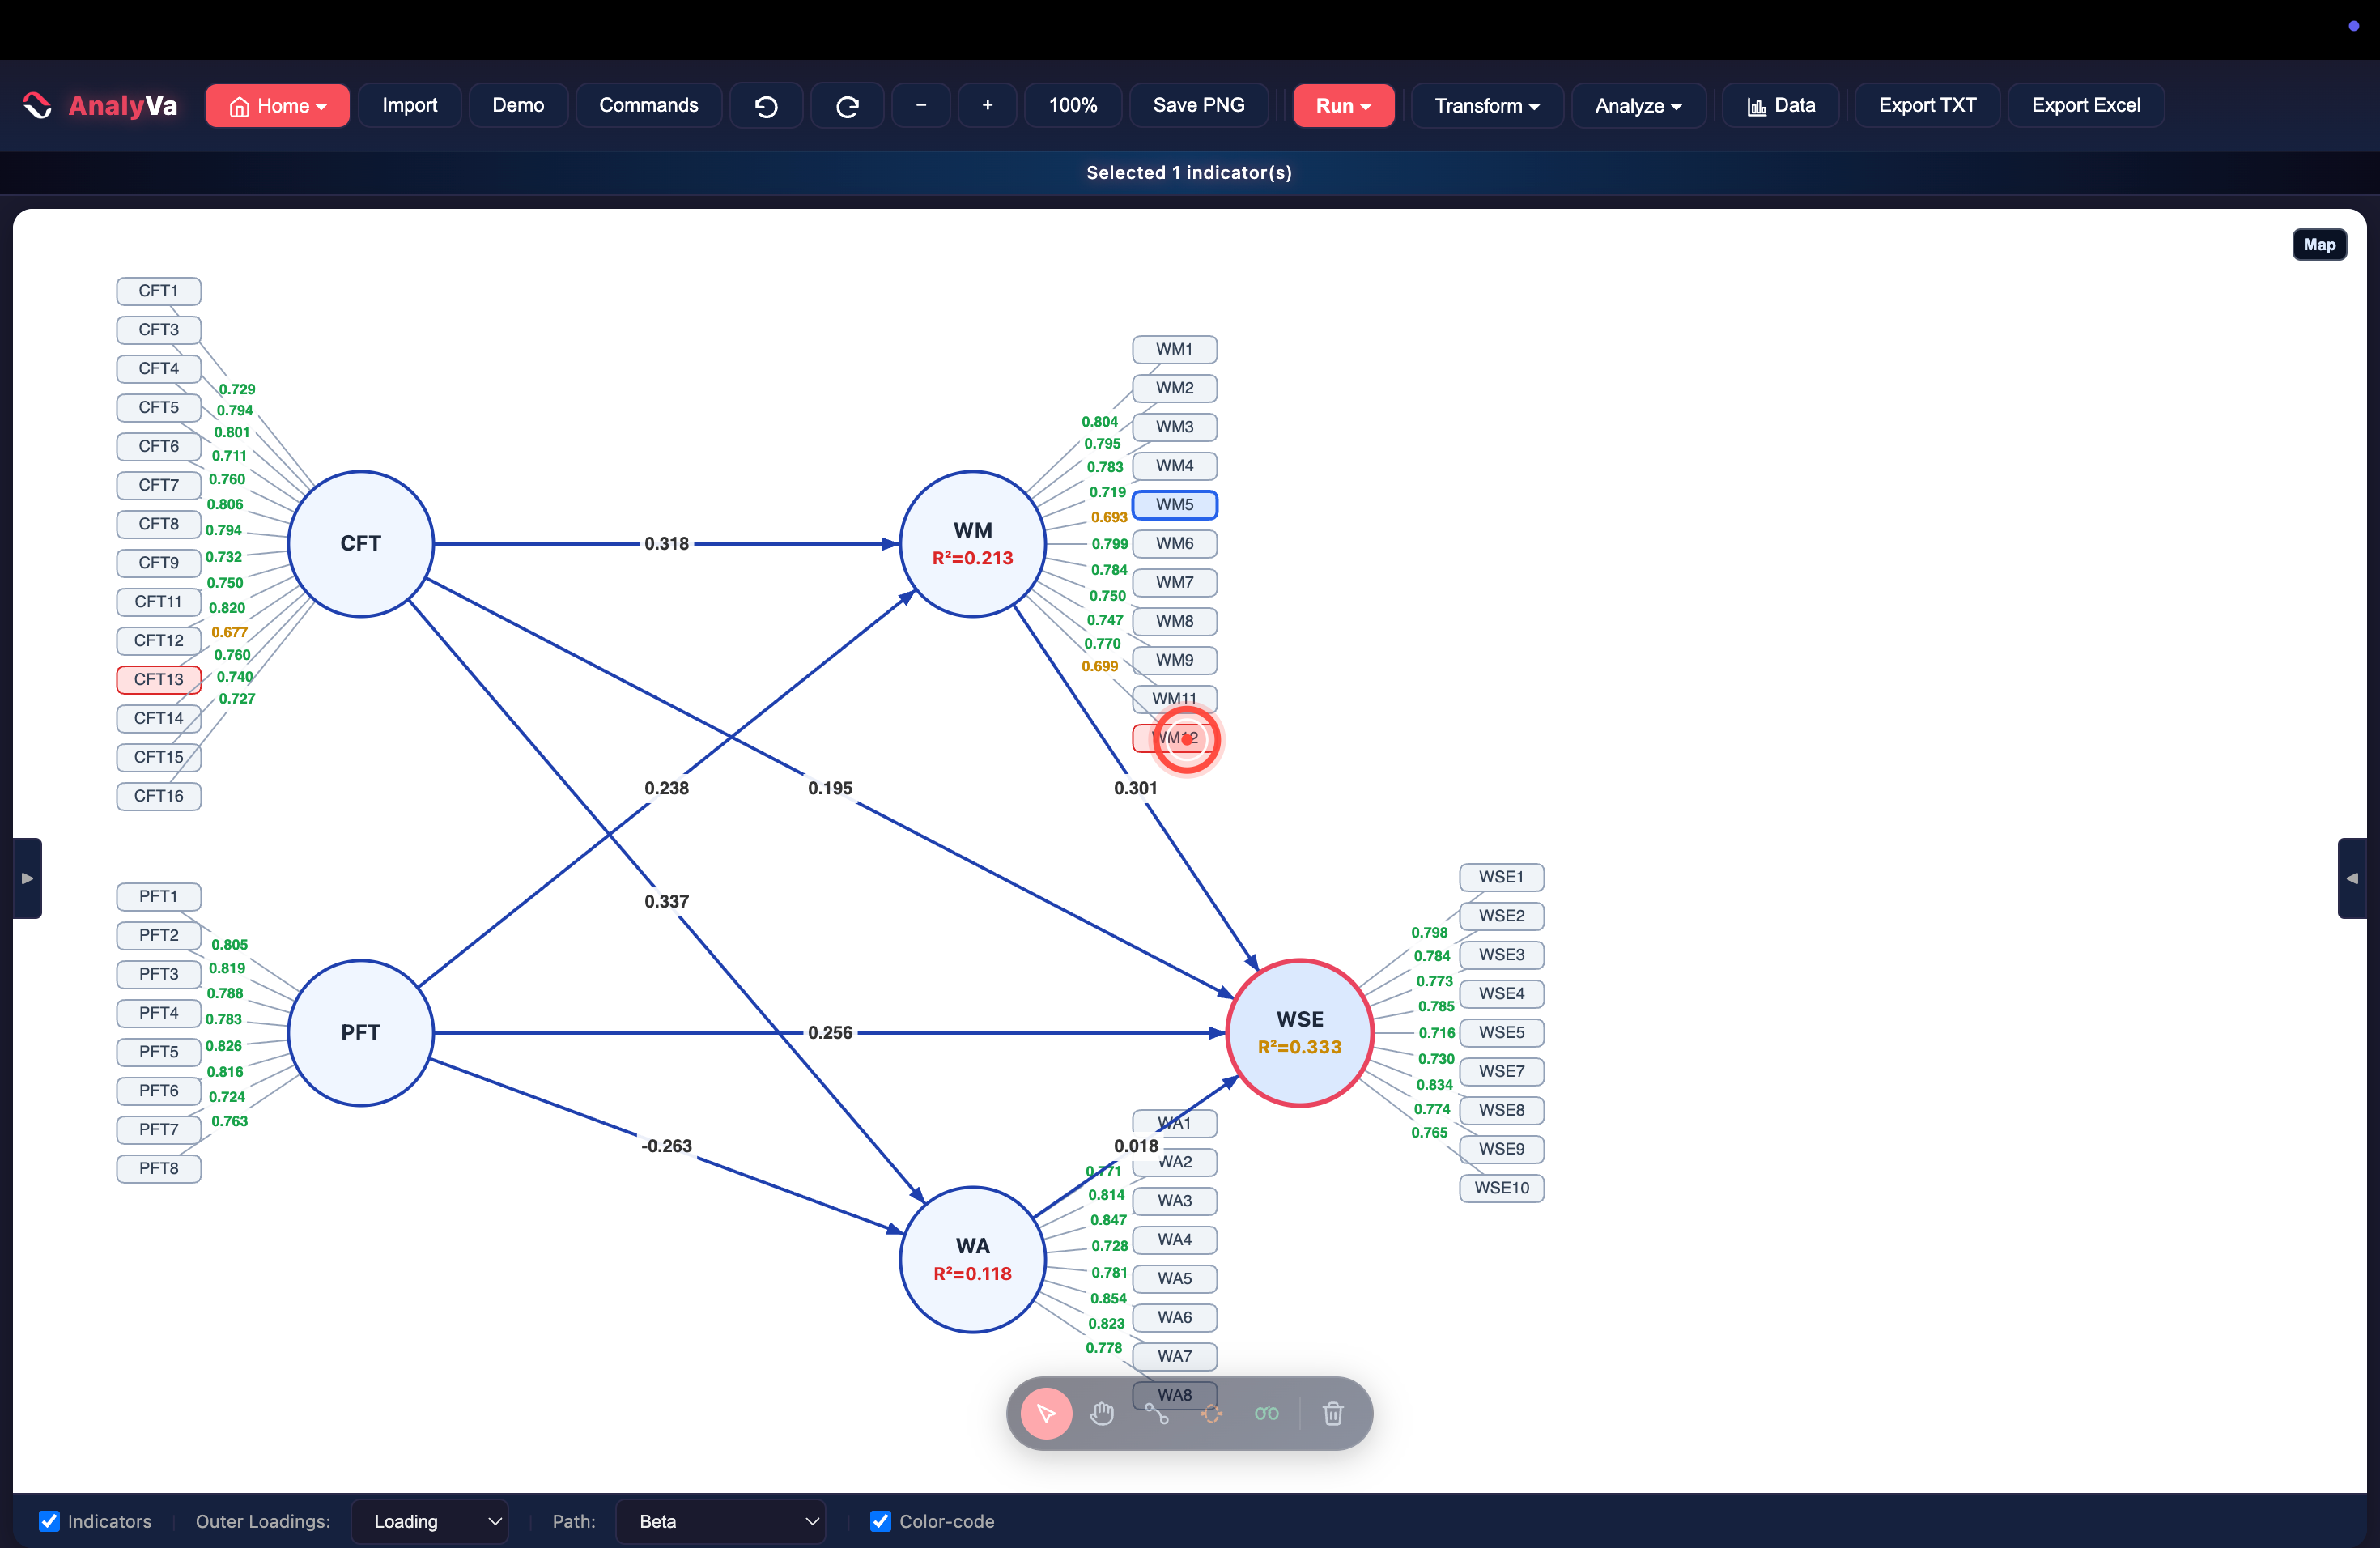
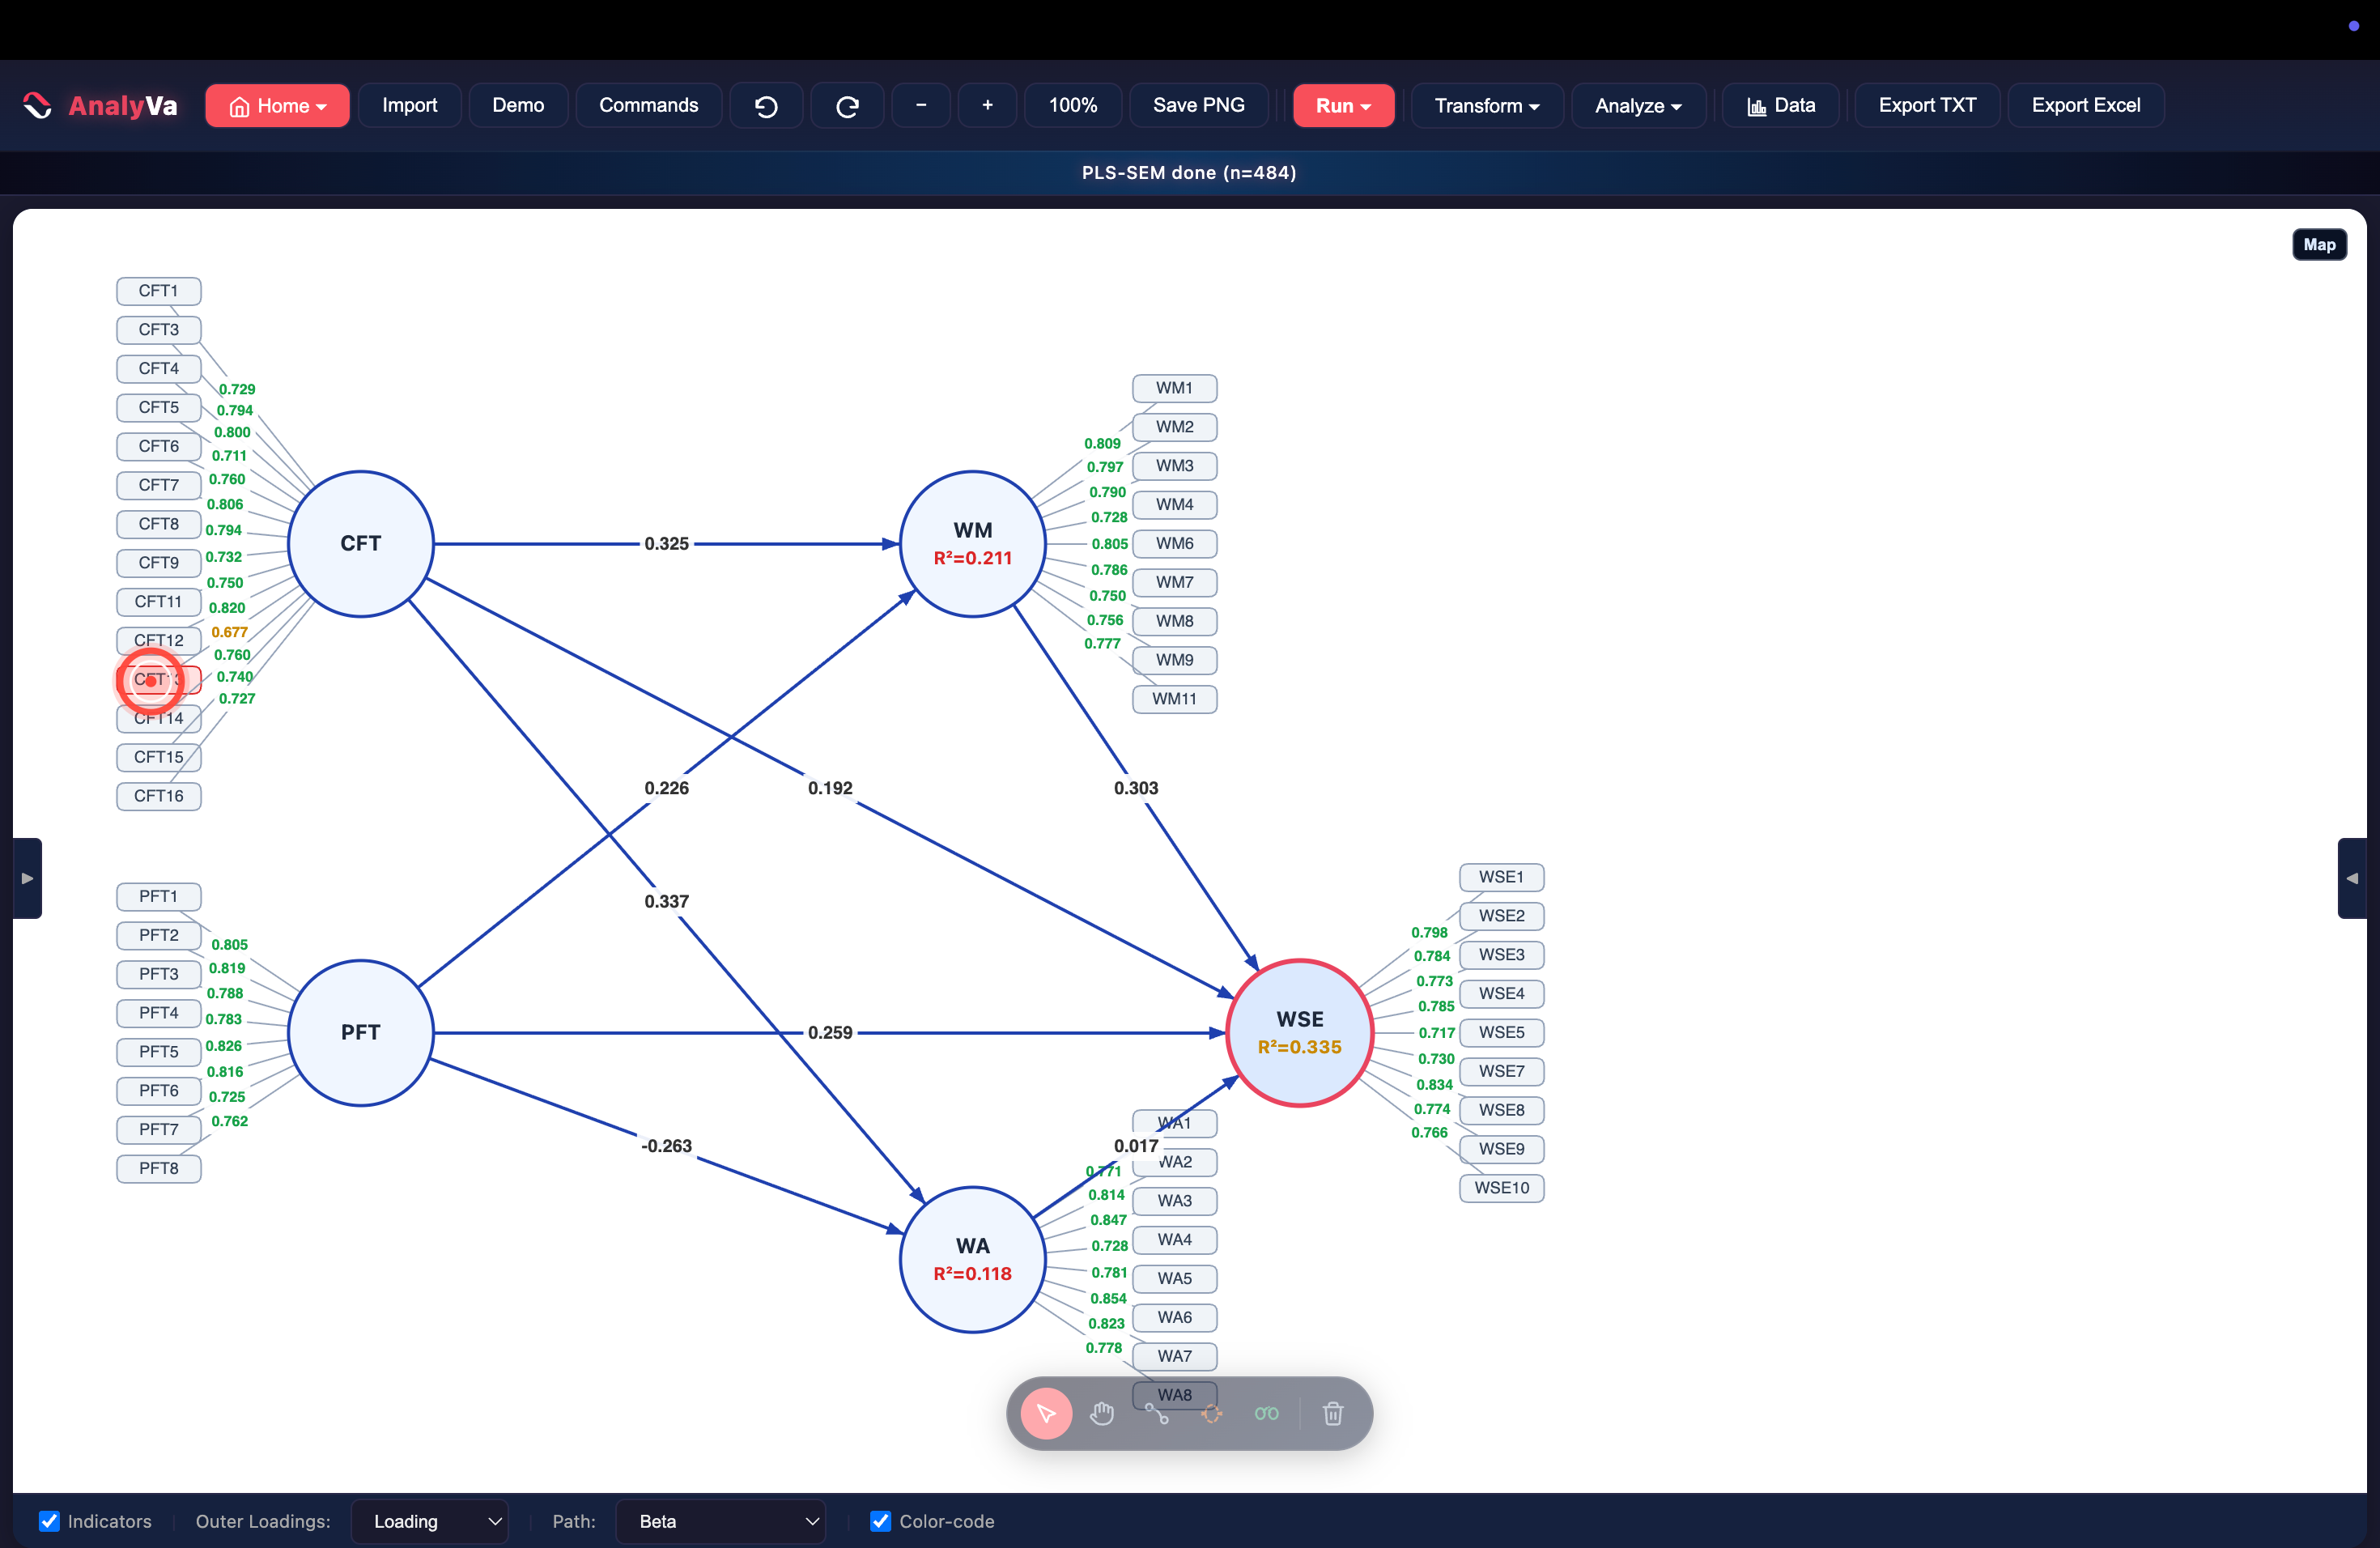
Step 8 — Find the same indicators on the canvas.
With Color-code enabled at the bottom toolbar, loadings below the
0.708 rule-of-thumb render in amber instead of green — the same three
values the health panel already named. WM12 is selected here (its
loading, 0.699, sits right on the canvas next to it) and CFT13 is
outlined in red.
Dropping the weak indicators
Step 9 — Select the offending indicator in the sidebar.
Click CFT13 in the left sidebar (or on the canvas). It highlights in
red to confirm the selection.
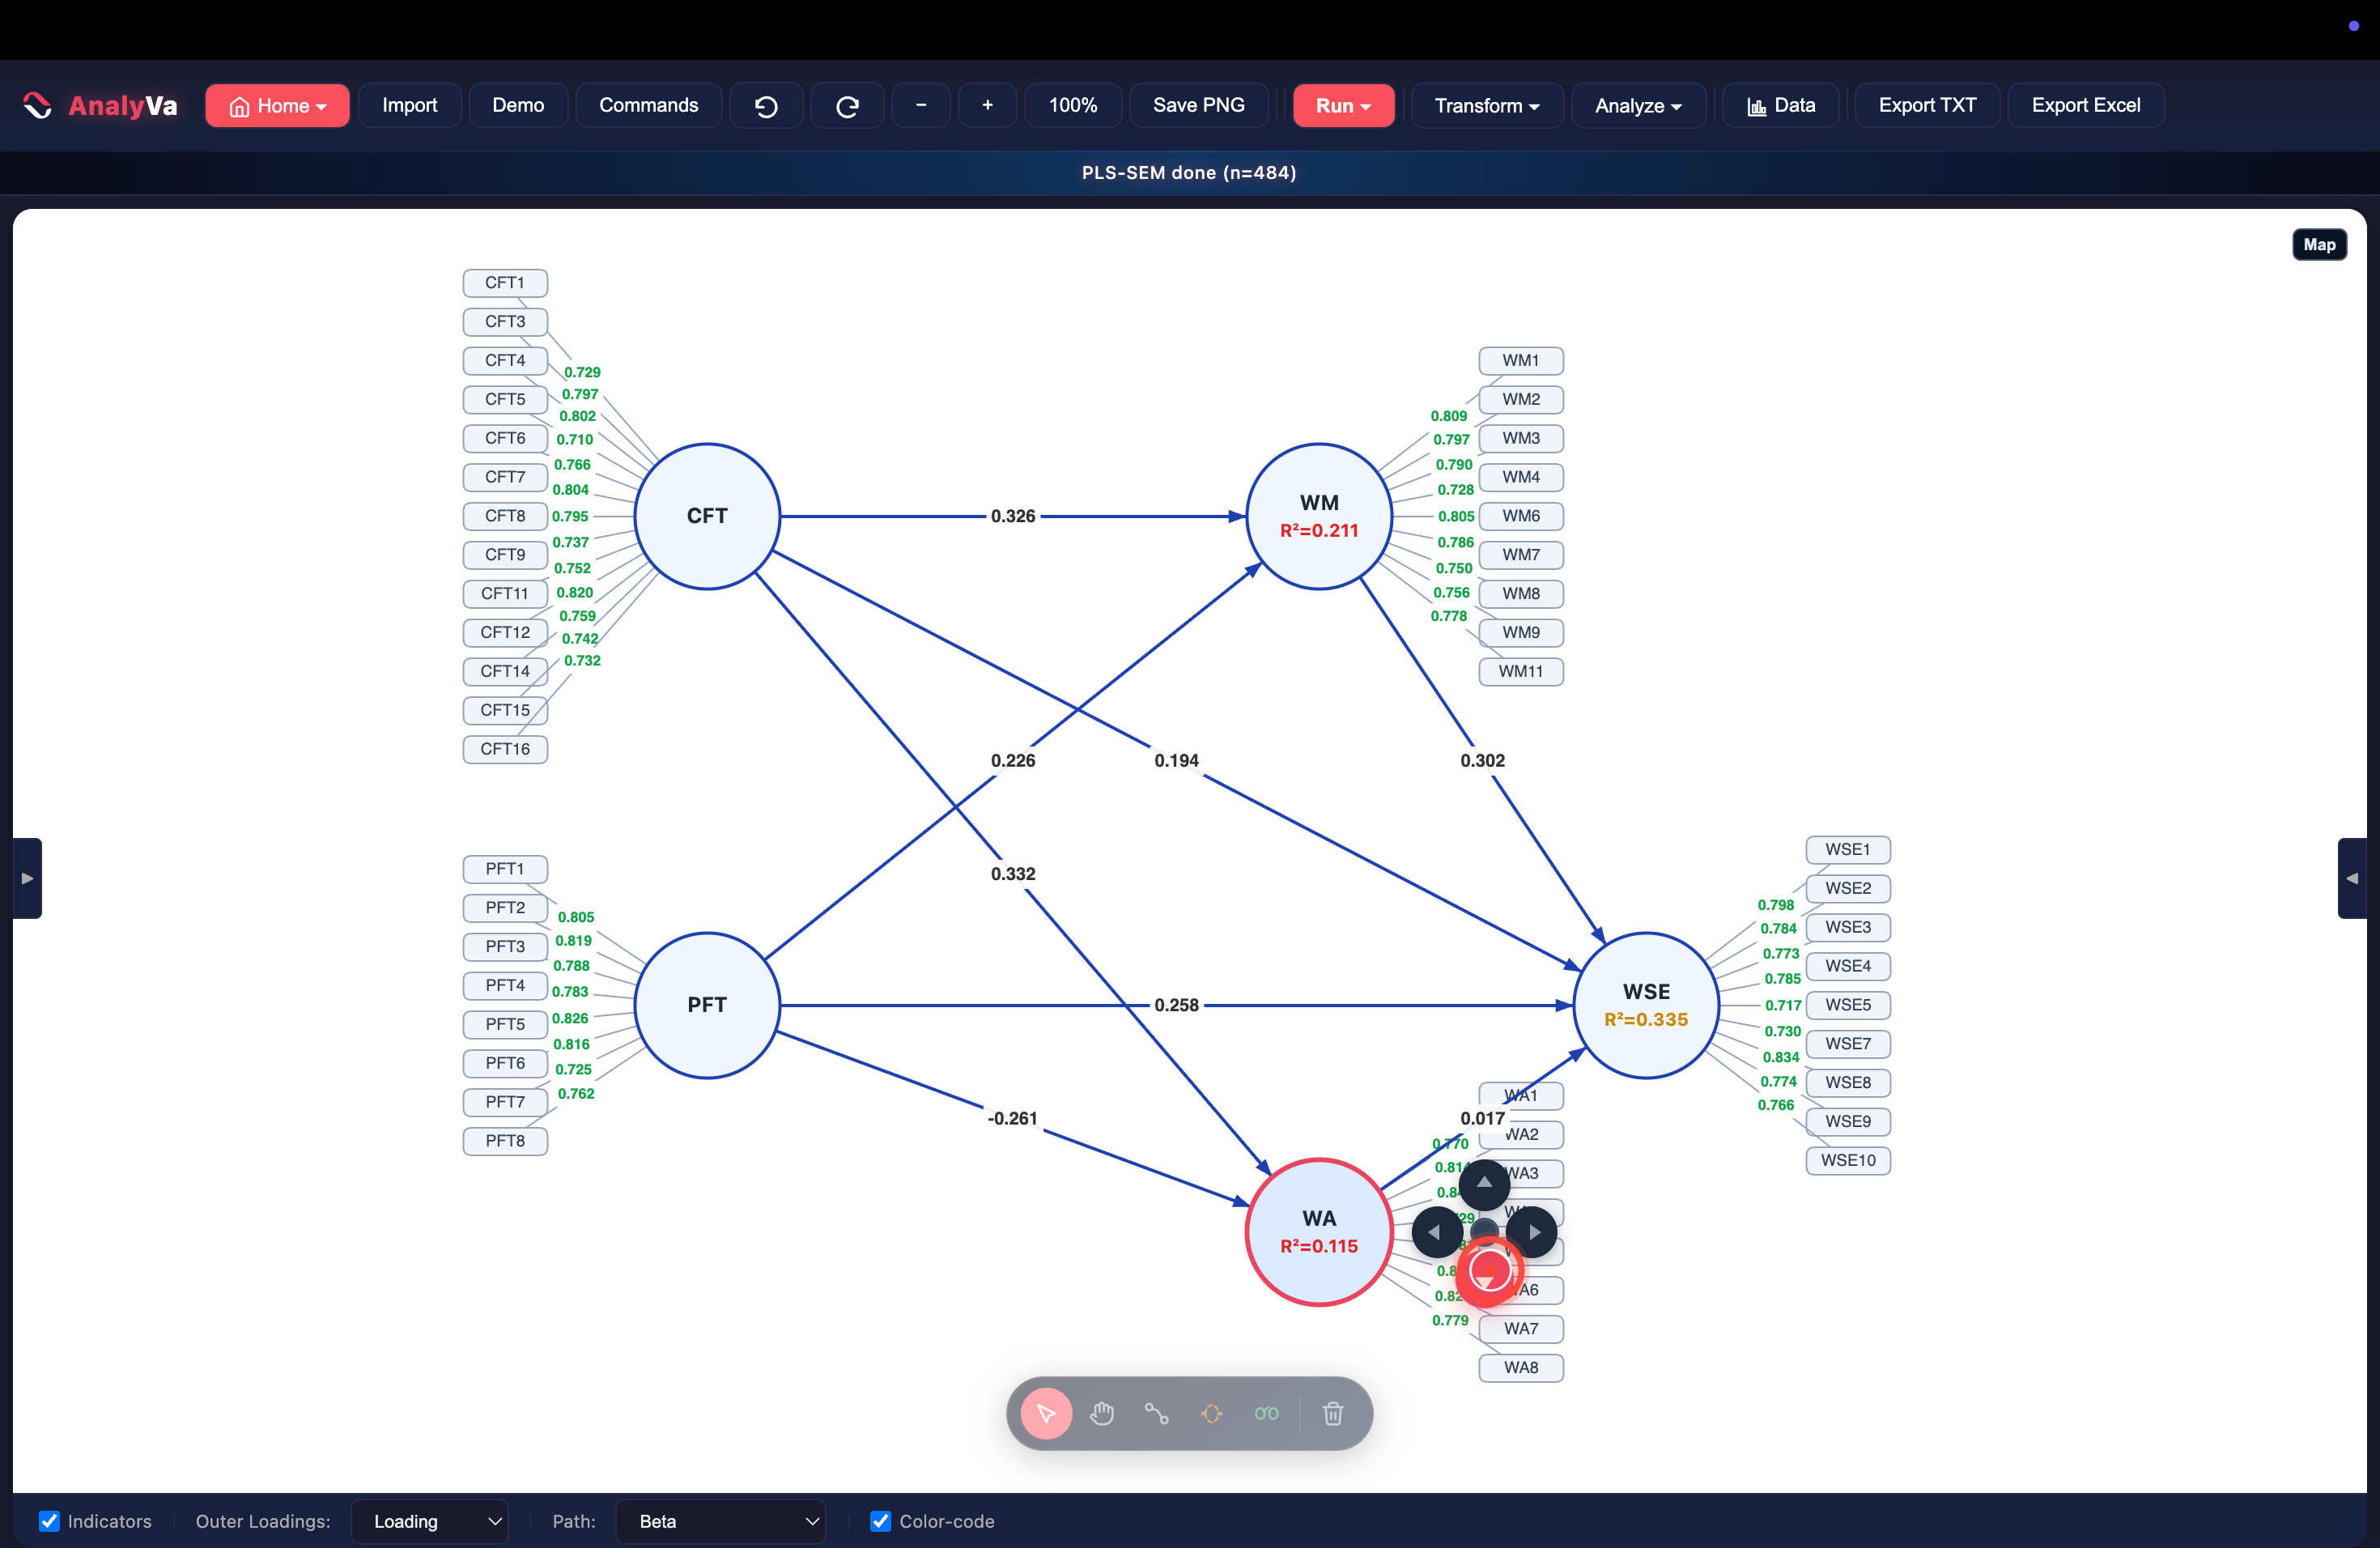
Select the construct on the canvas, switch to its Props panel, tick
the indicator(s) to remove — CFT13 and WM12 — and click Delete
Selected. AnalyVa updates the construct’s indicator list immediately;
no separate confirmation step.
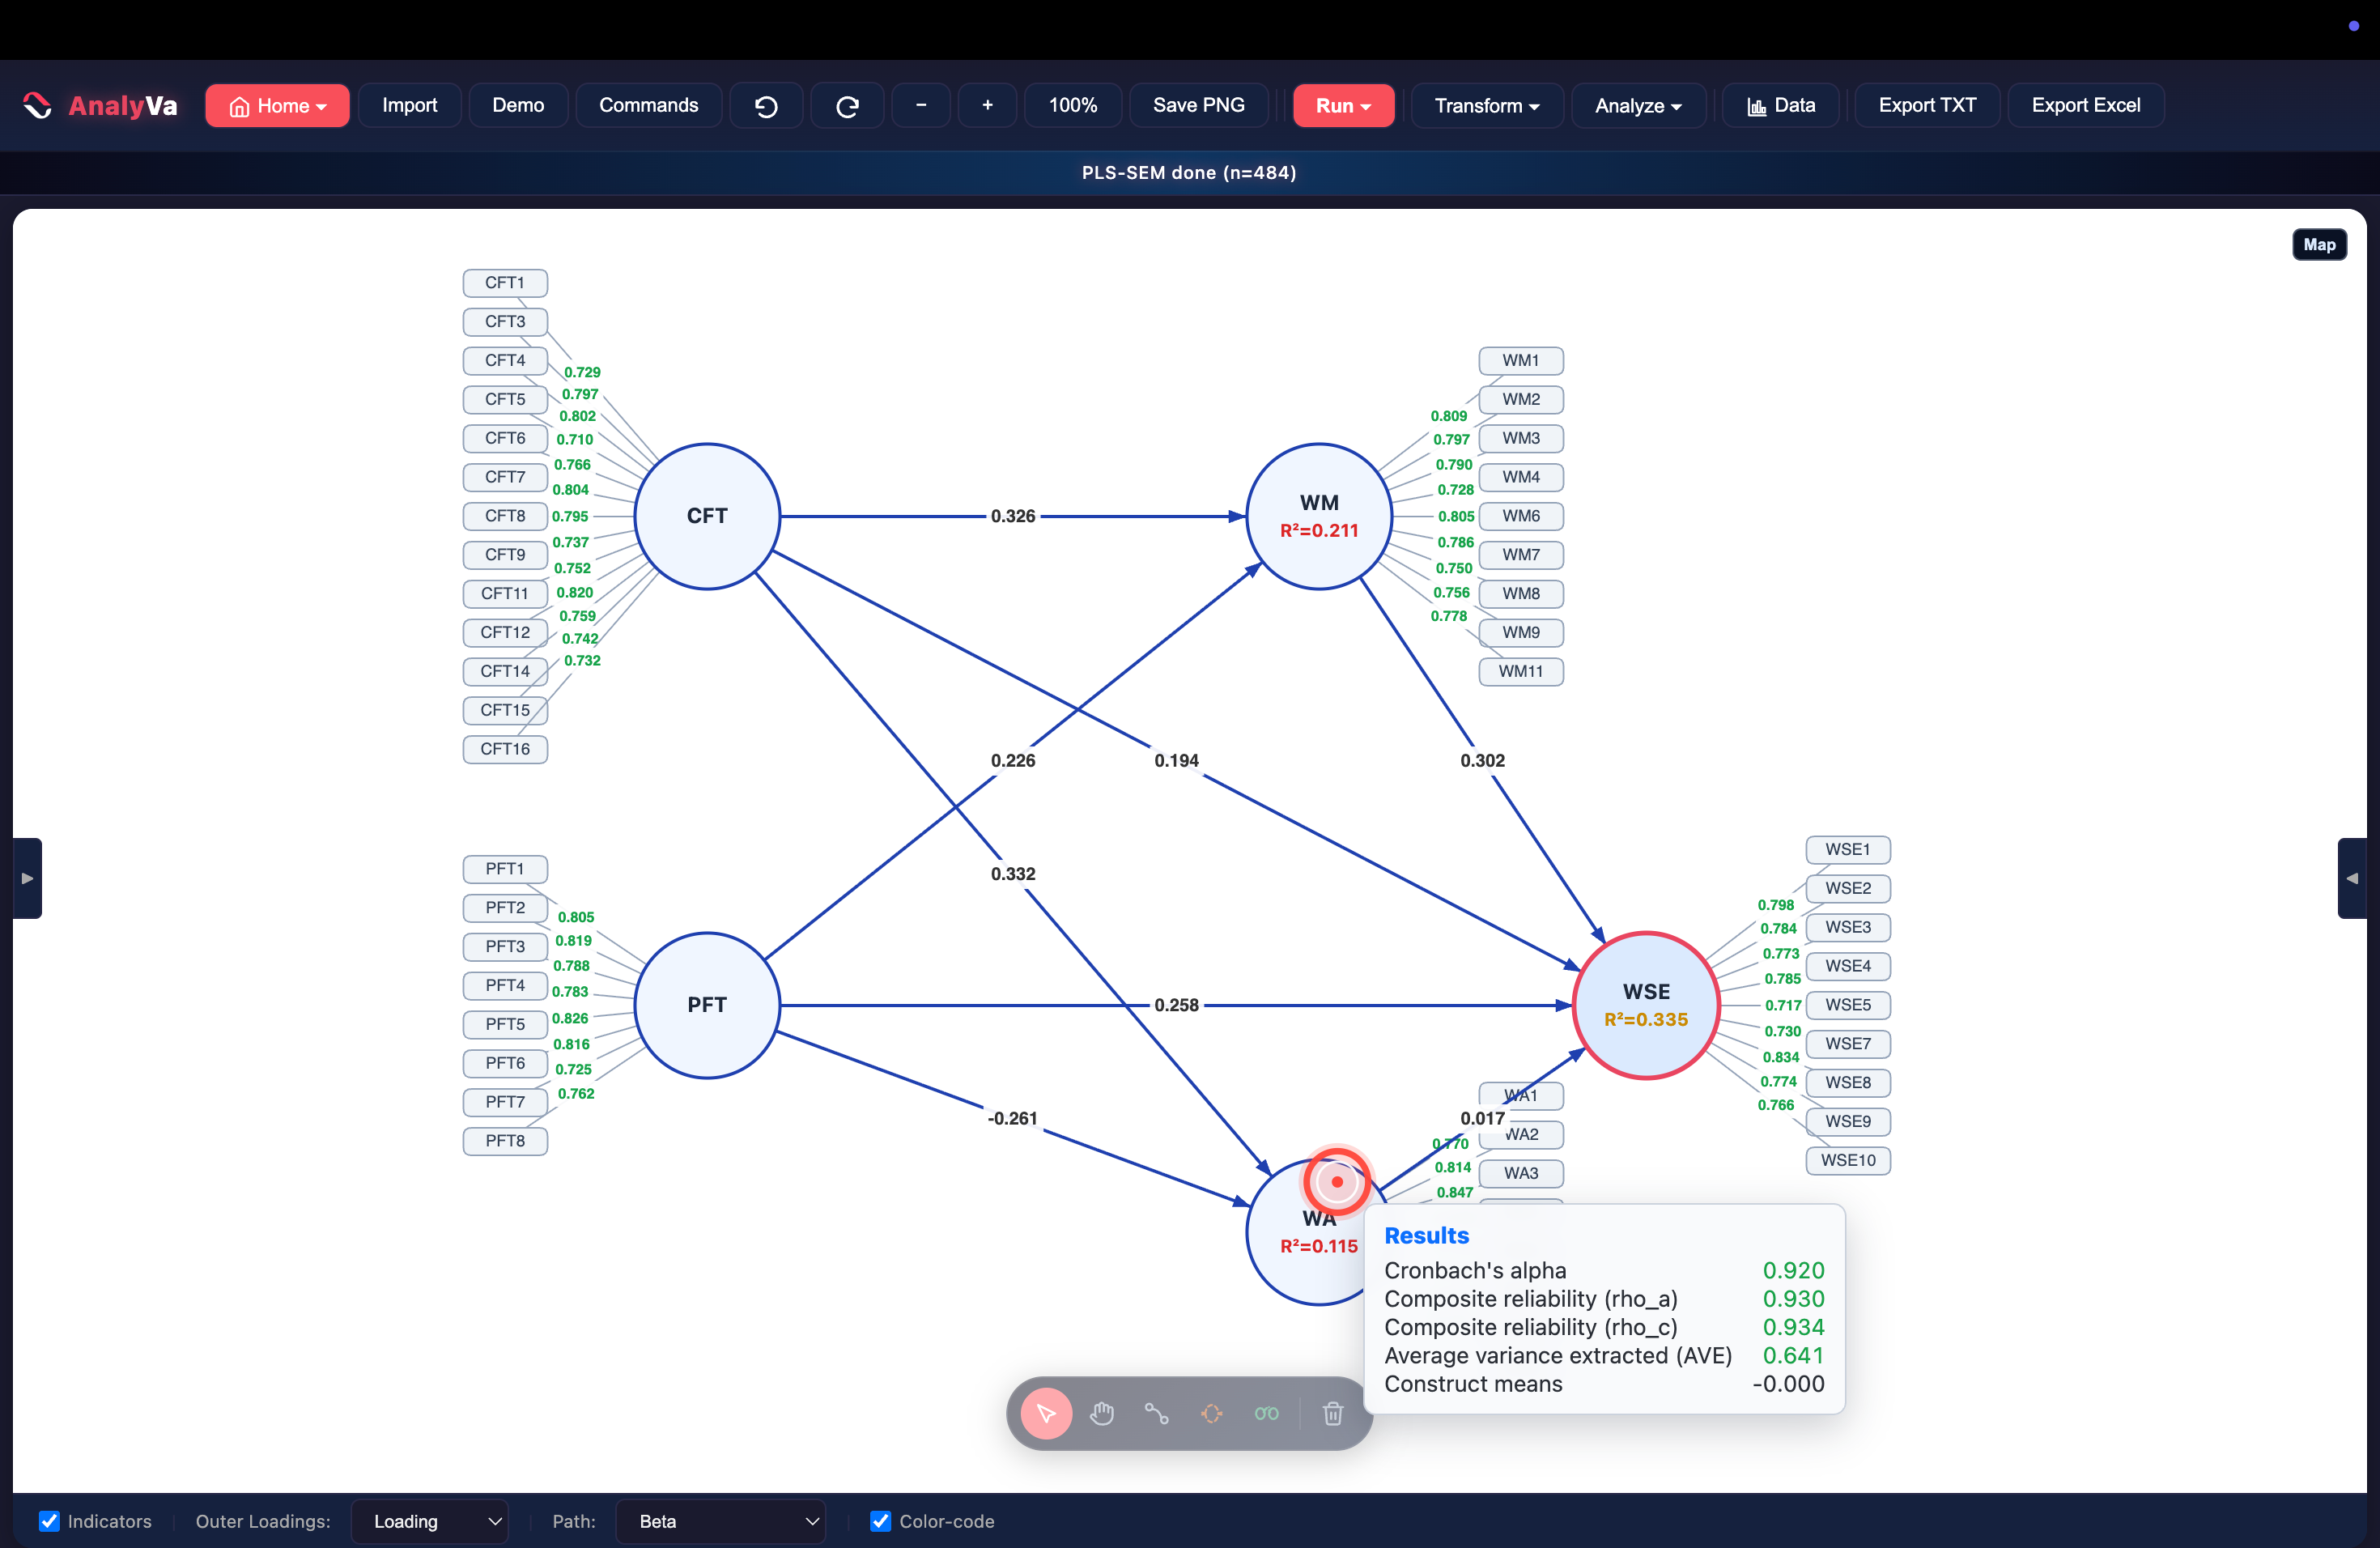
Step 10 — Re-run and check reliability. With the weak indicators gone, re-run PLS-SEM algorithm the same way as Step 6. AnalyVa reports the run as “PLS-SEM done (n=484)”. Hovering a construct now surfaces its reliability block directly on the canvas:
- Cronbach’s alpha: 0.920
- Composite reliability (rho_a): 0.930
- Composite reliability (rho_c): 0.934
- Average variance extracted (AVE): 0.641
All comfortably above the 0.70 / 0.50 thresholds.
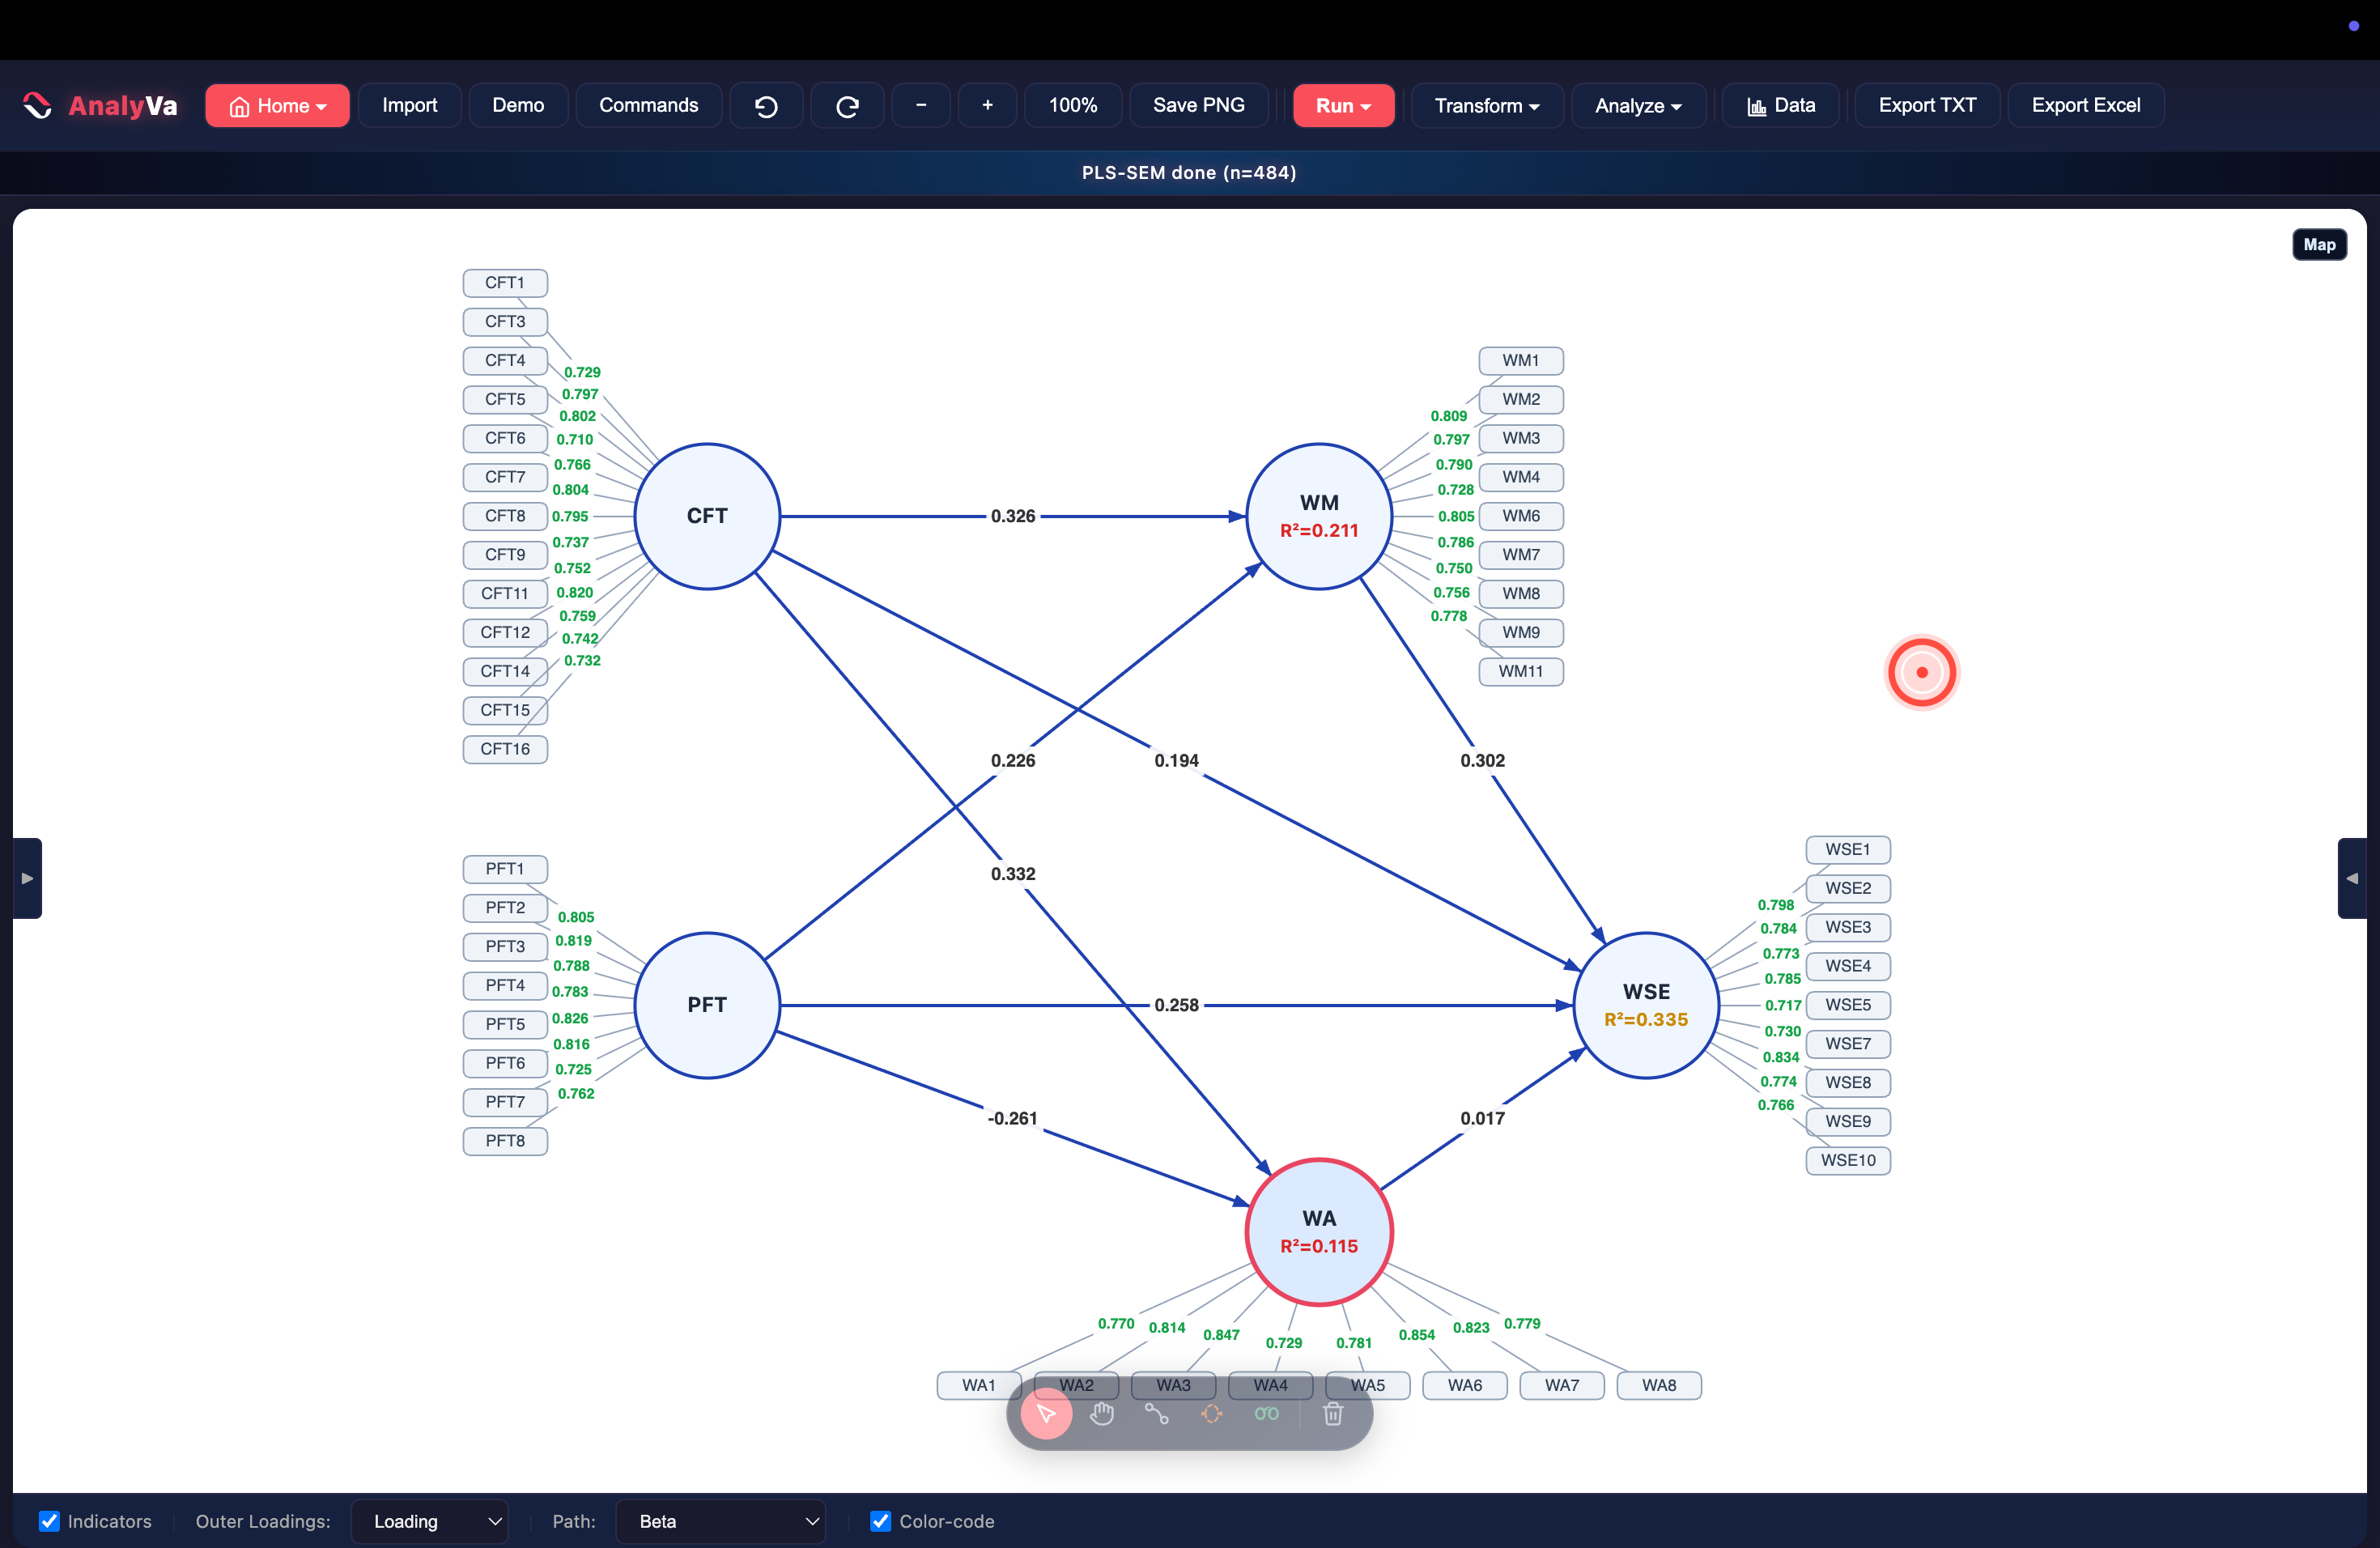
Step 11 — Confirm every remaining loading is clean.
CFT now runs CFT1 through CFT16 minus CFT13; WM runs WM1
through WM11 minus WM12. Every visible loading is green.
Step 12 — The final model. R² values barely move (WM: 0.211, WA: 0.115, WSE: 0.335 — practically identical to the 12-indicator version), which is expected: two weak formative-adjacent items rarely carry much of a reflective construct’s explanatory power. What changes is defensibility — every loading in the measurement model now clears 0.708 without an asterisk in the write-up.
Why this matters for reporting
Dropping indicators purely to inflate loadings is a real methodological risk — reviewers know the difference between principled cleanup and p-hacking a measurement model. The rule that keeps this defensible: drop an indicator only when its loading is weak and the construct’s AVE improves and the theoretical content coverage doesn’t collapse. AnalyVa’s Smart Model Health panel gives you the first signal automatically; the AVE and content-validity call is still yours to make.
The order that matters
- Build and run the full model first — don’t pre-emptively drop indicators before seeing real loadings.
- Read the Smart Model Health panel before scanning tables by eye.
- Cross-check the flagged indicators against theoretical coverage, not just the number.
- Delete, re-run, and re-check reliability and AVE — never assume removing one weak item won’t shift another.
- Run bootstrapping before finalizing path significance (the health panel will remind you if you forget).