Multi-group analysis (MGA) asks a simple question with a fiddly setup: does a path coefficient differ between two groups — men and women, novice and expert users, before and after an intervention? Before AnalyVa can split a model by group, that grouping variable has to exist and be labeled clearly. This post covers both halves: recoding a raw numeric column into a labeled grouping variable, and then using it to run an actual group comparison in the PLS-SEM dialog.
Preparing the grouping variable
The dataset here is a 1,311-row student survey. Gender is already
numeric (1 / 2), which AnalyVa can group on directly — but labeling
it first makes every downstream table and chart readable.
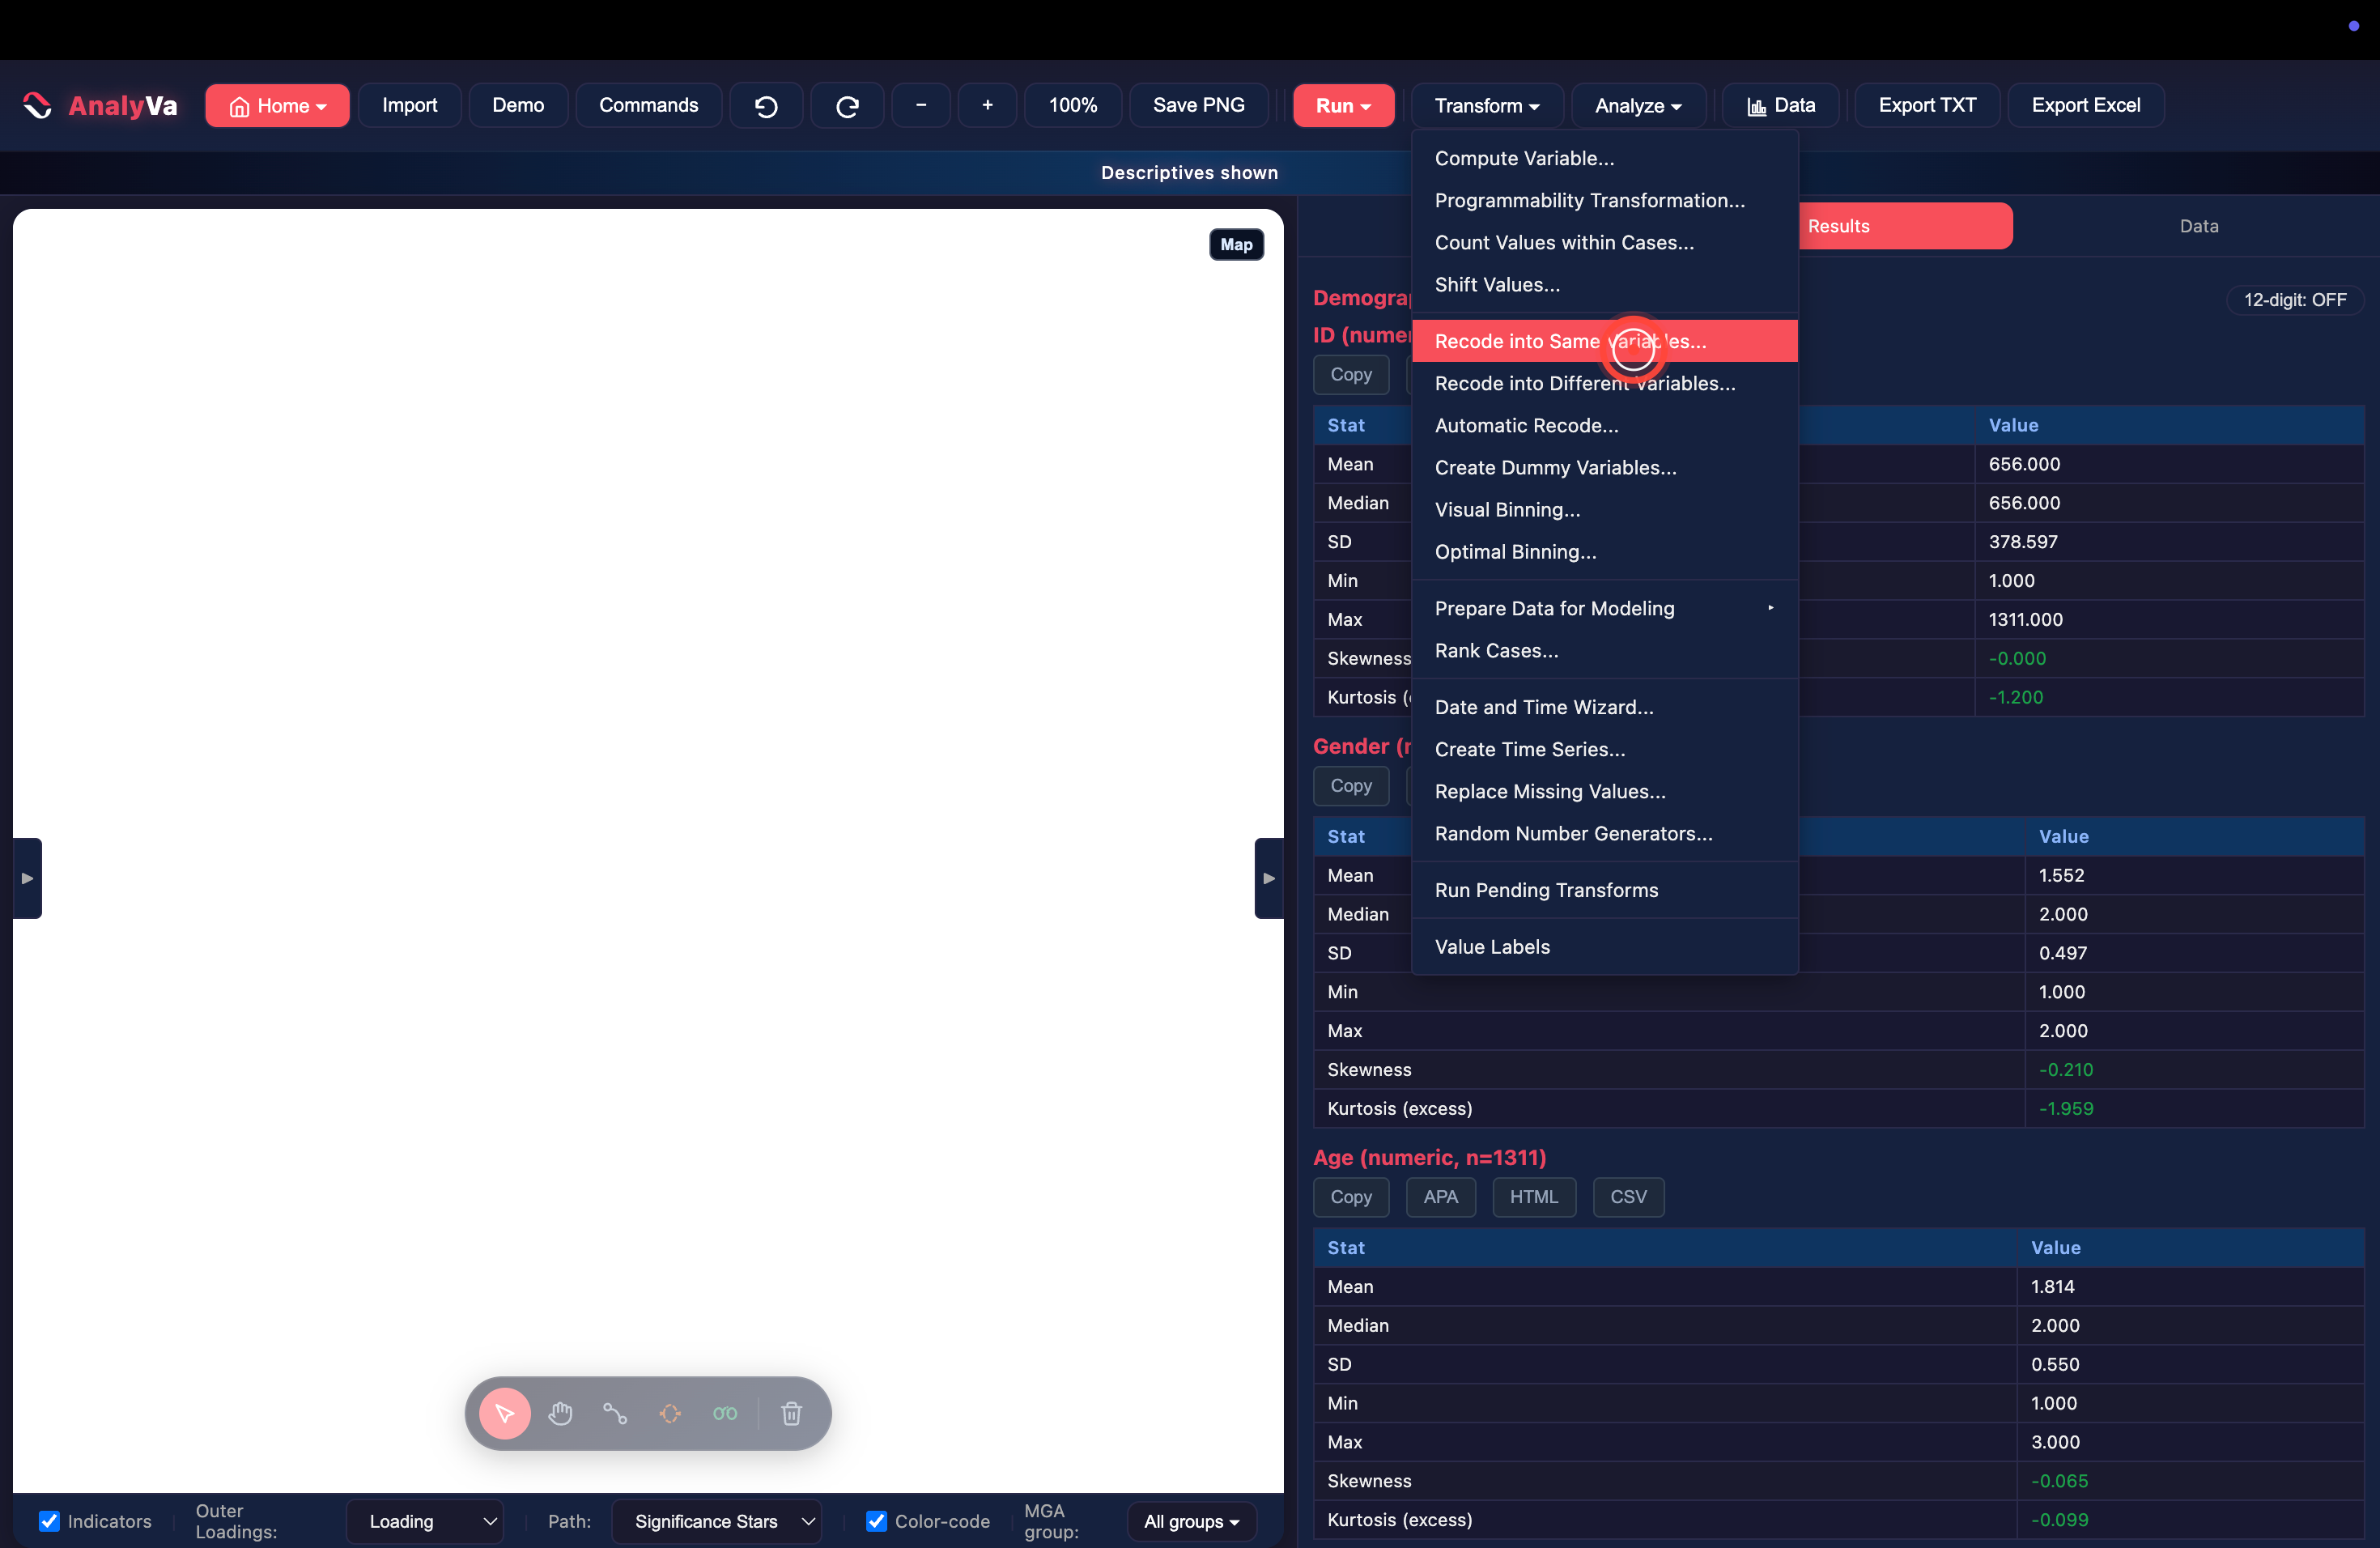
Step 1 — Open Transform → Recode into Same Variables.
With descriptives already reviewed, open the Transform menu.
Recode into Same Variables overwrites the values in place — the
right choice for turning 1/2 into readable labels without keeping
a duplicate column.
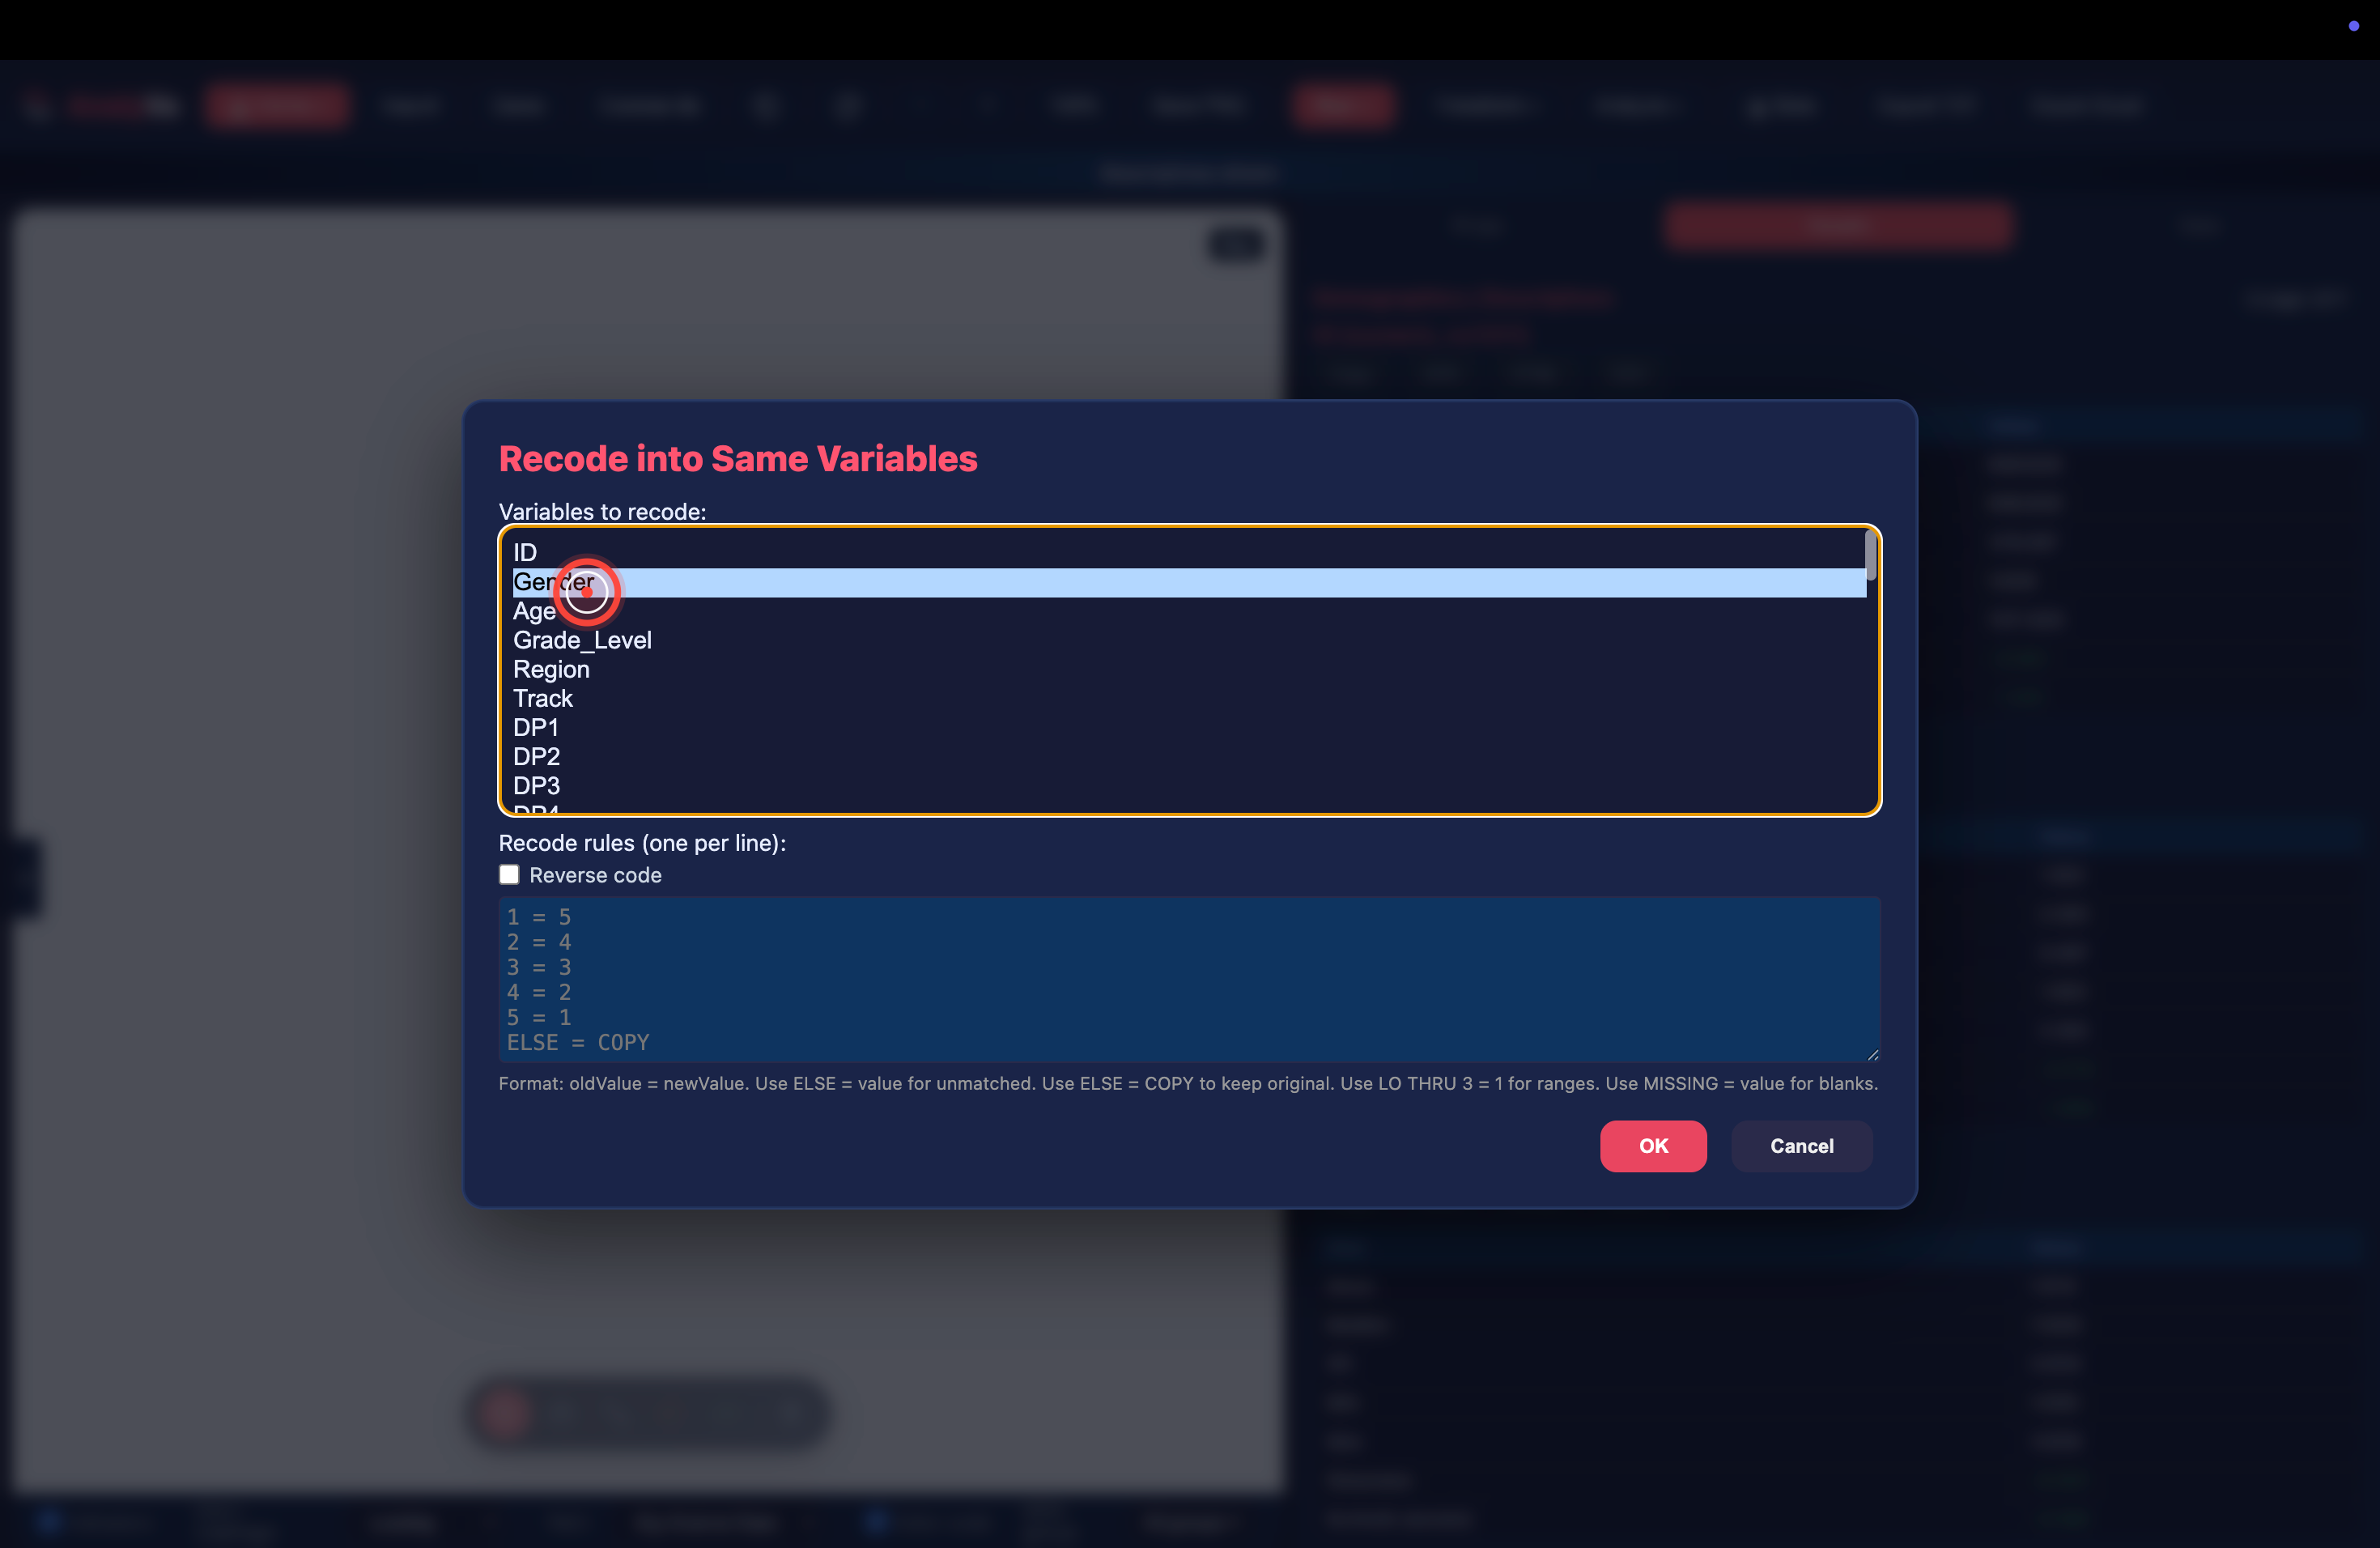
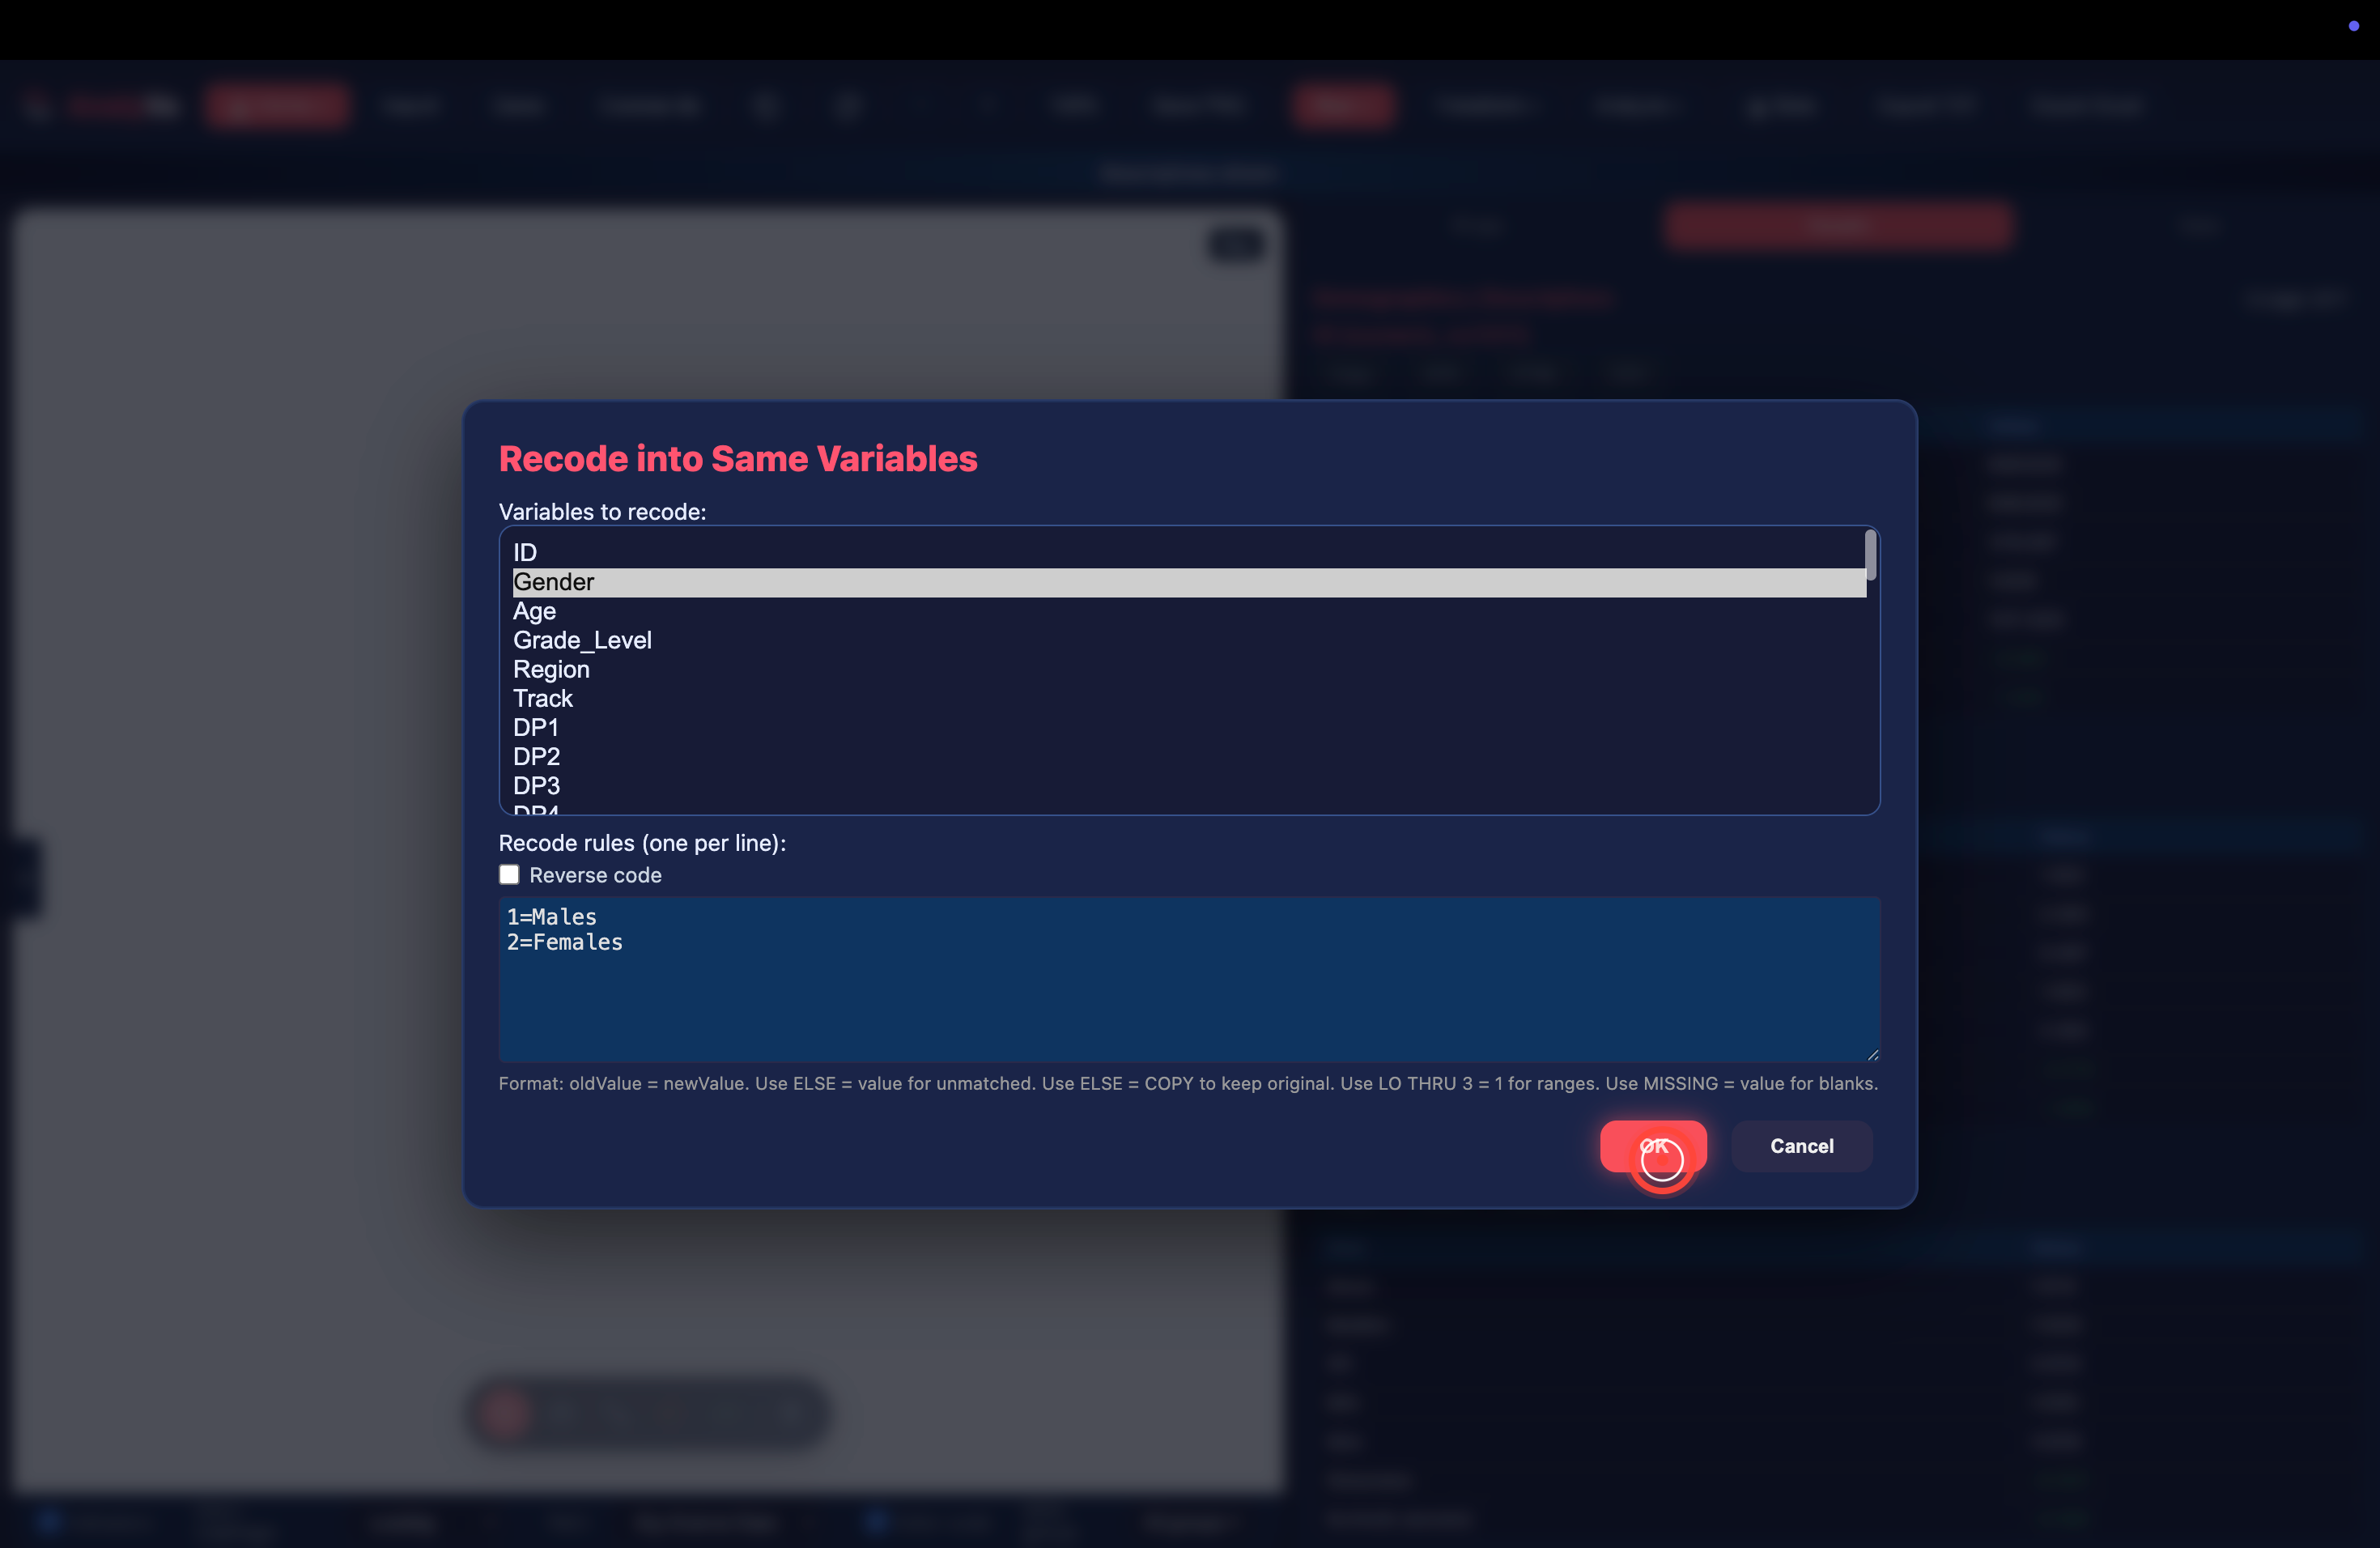
Step 2 — Select Gender from the variable list.
The dialog lists every variable in the dataset. Click Gender.
Step 3 — Clear the example template. The rules box starts with placeholder text illustrating the syntax (a 5-point reverse-code example, in this case) — not the rule for this variable. Clear it.
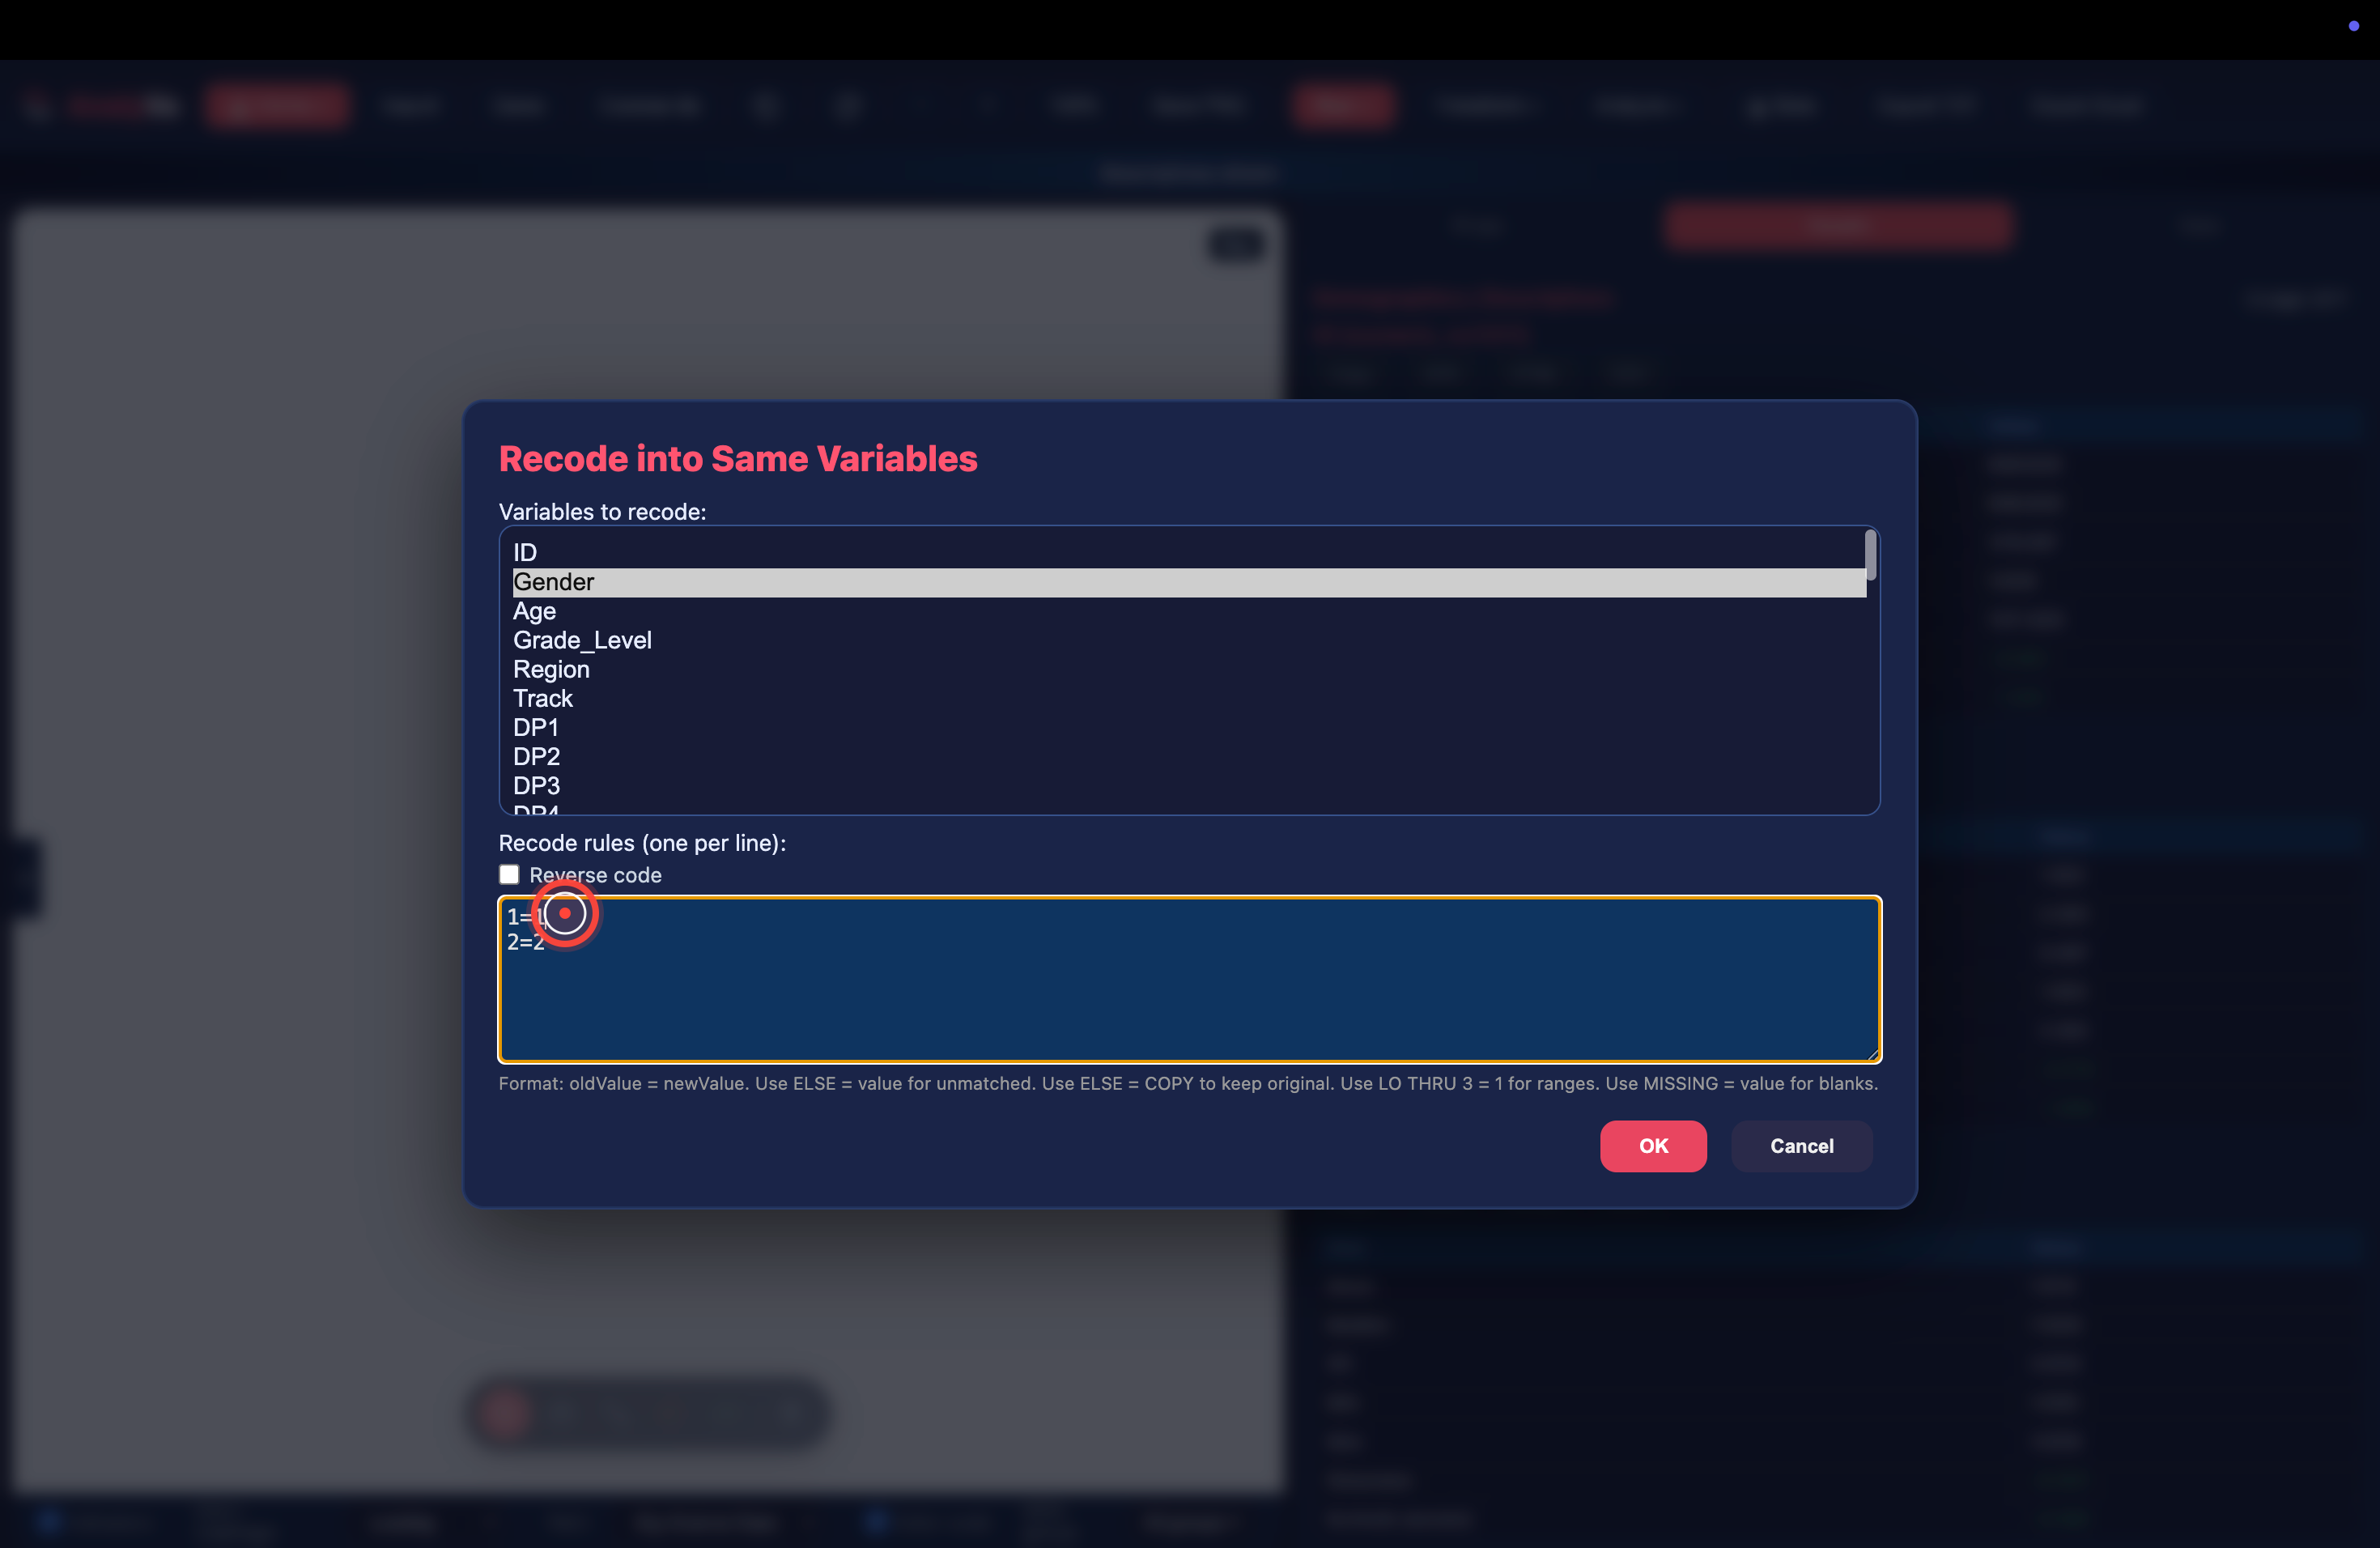
Step 4 — Type the actual mapping.
One rule per line, oldValue = newValue:
1=Males
2=Females
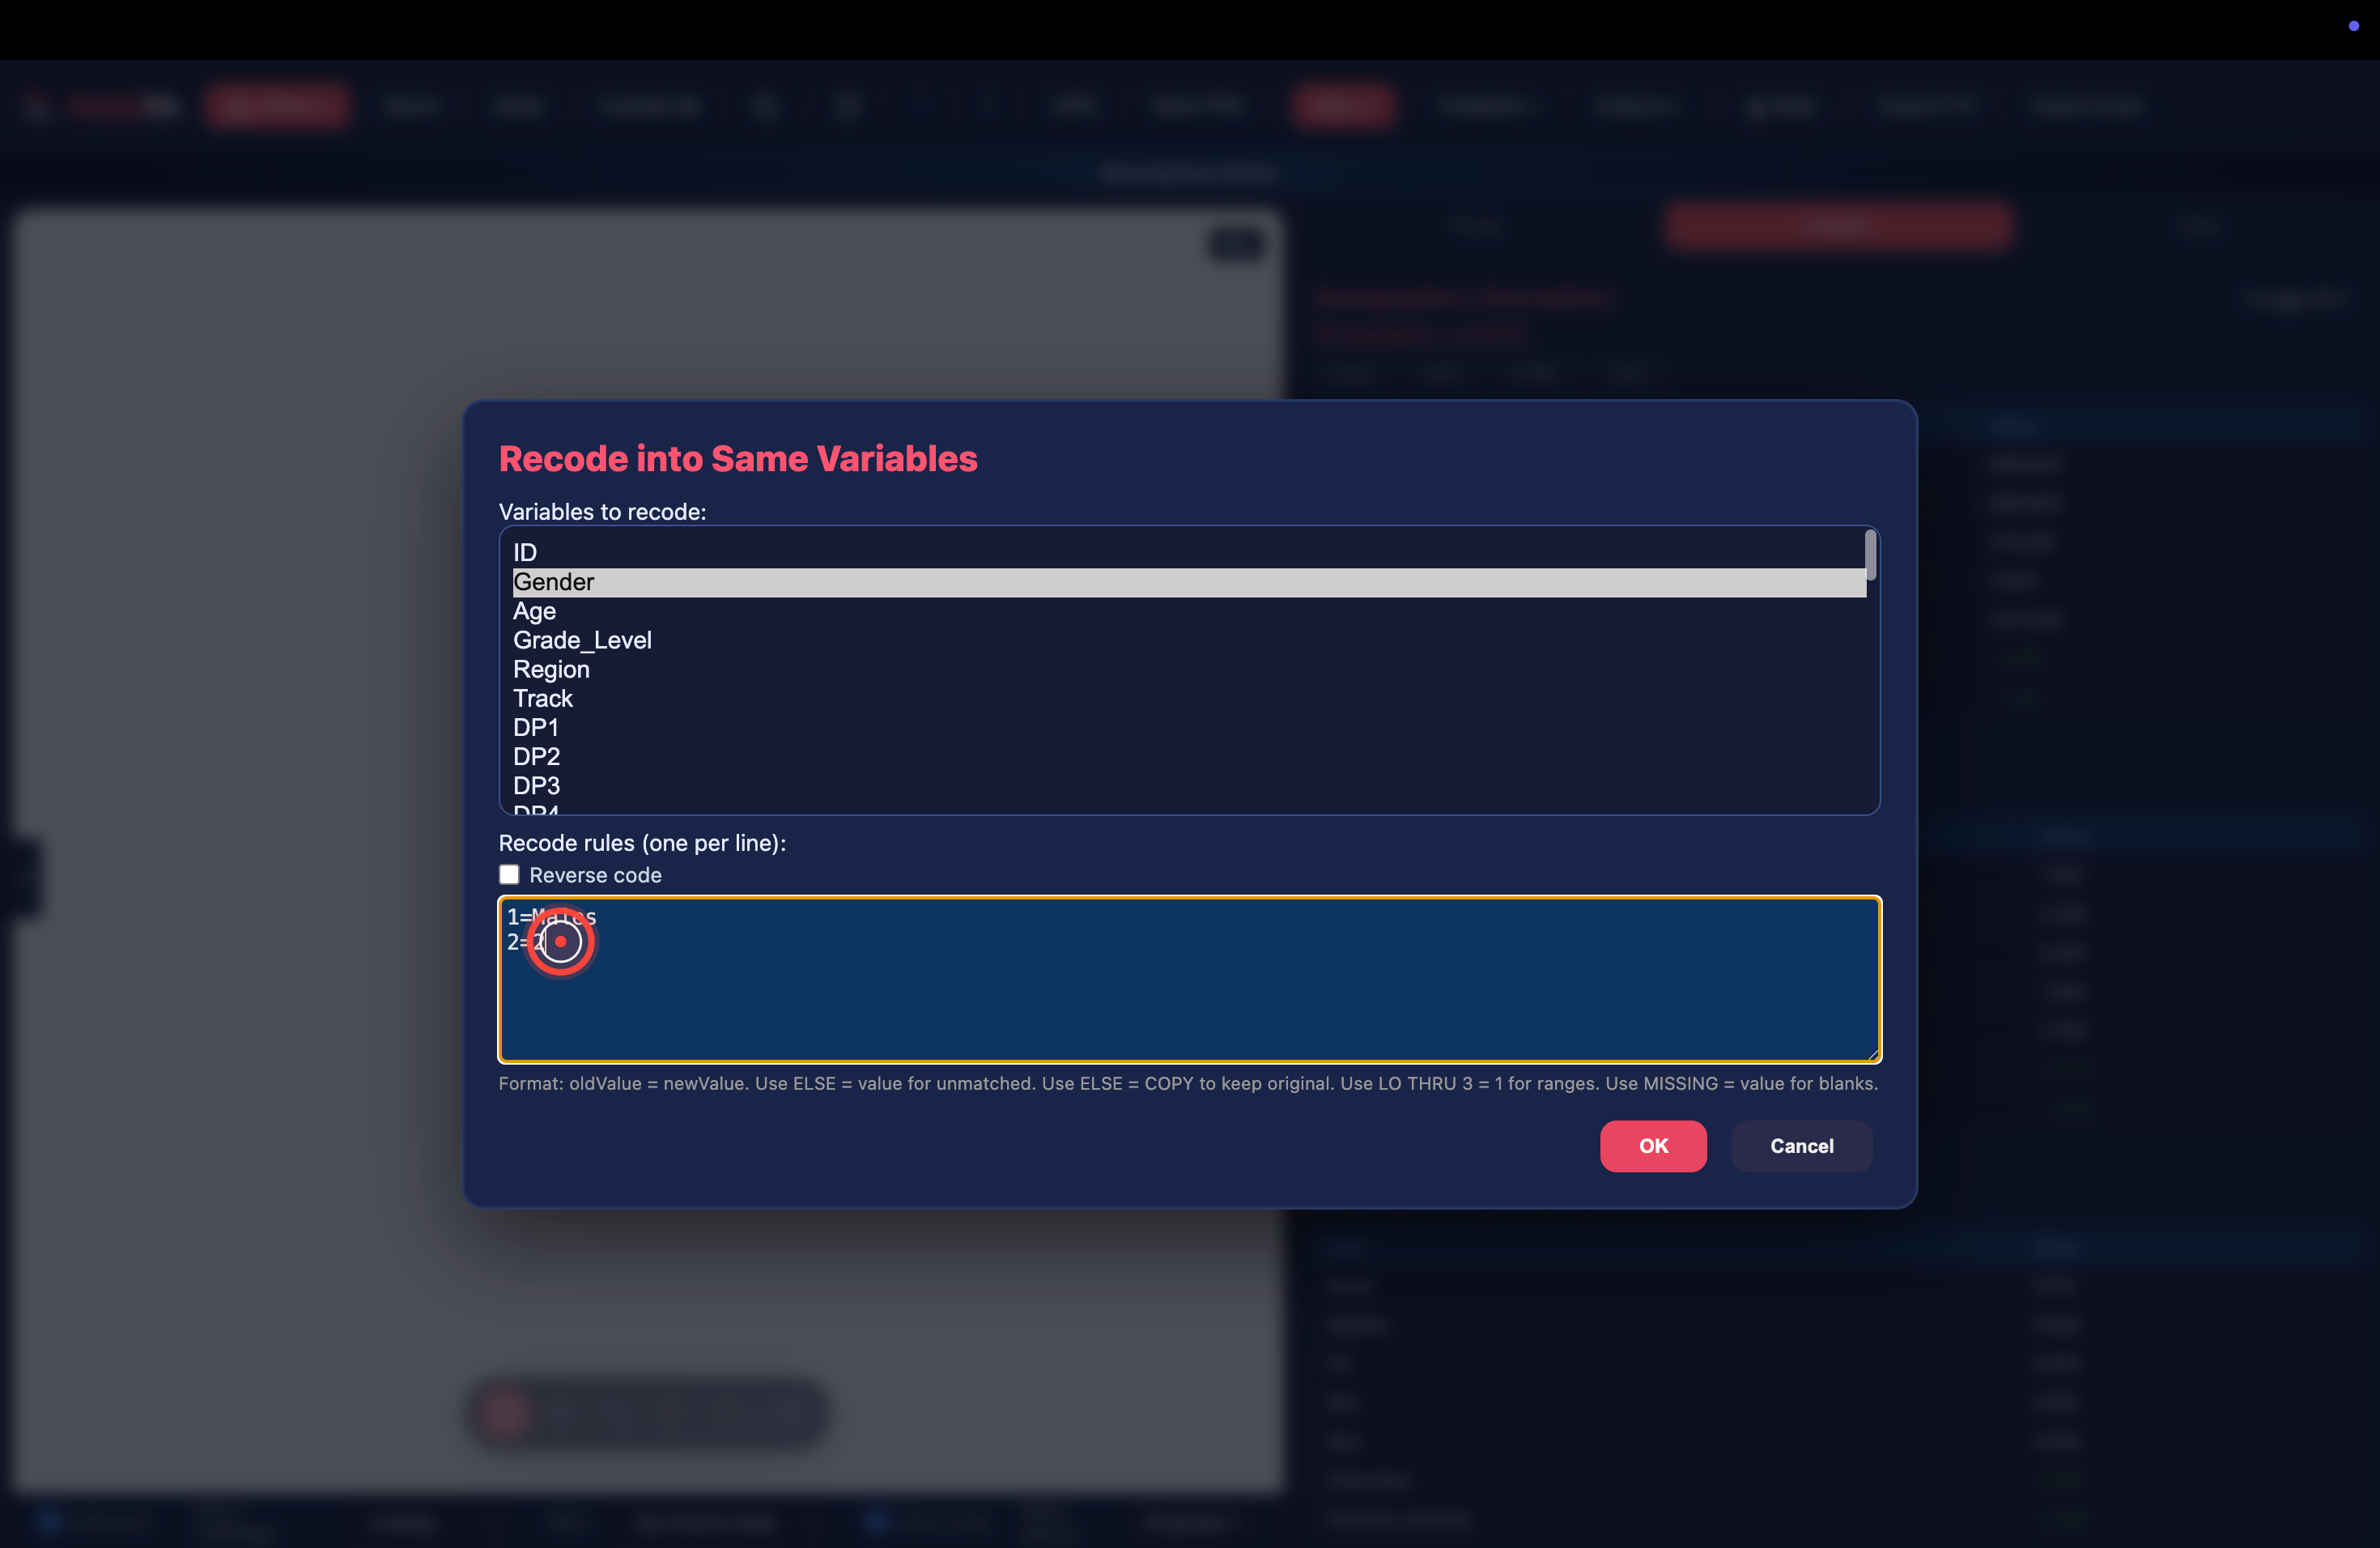
Step 5 — Click OK. AnalyVa applies the recode in place.
Verifying the recode
Never trust a recode without checking it — a typo in the mapping silently corrupts every downstream group comparison.
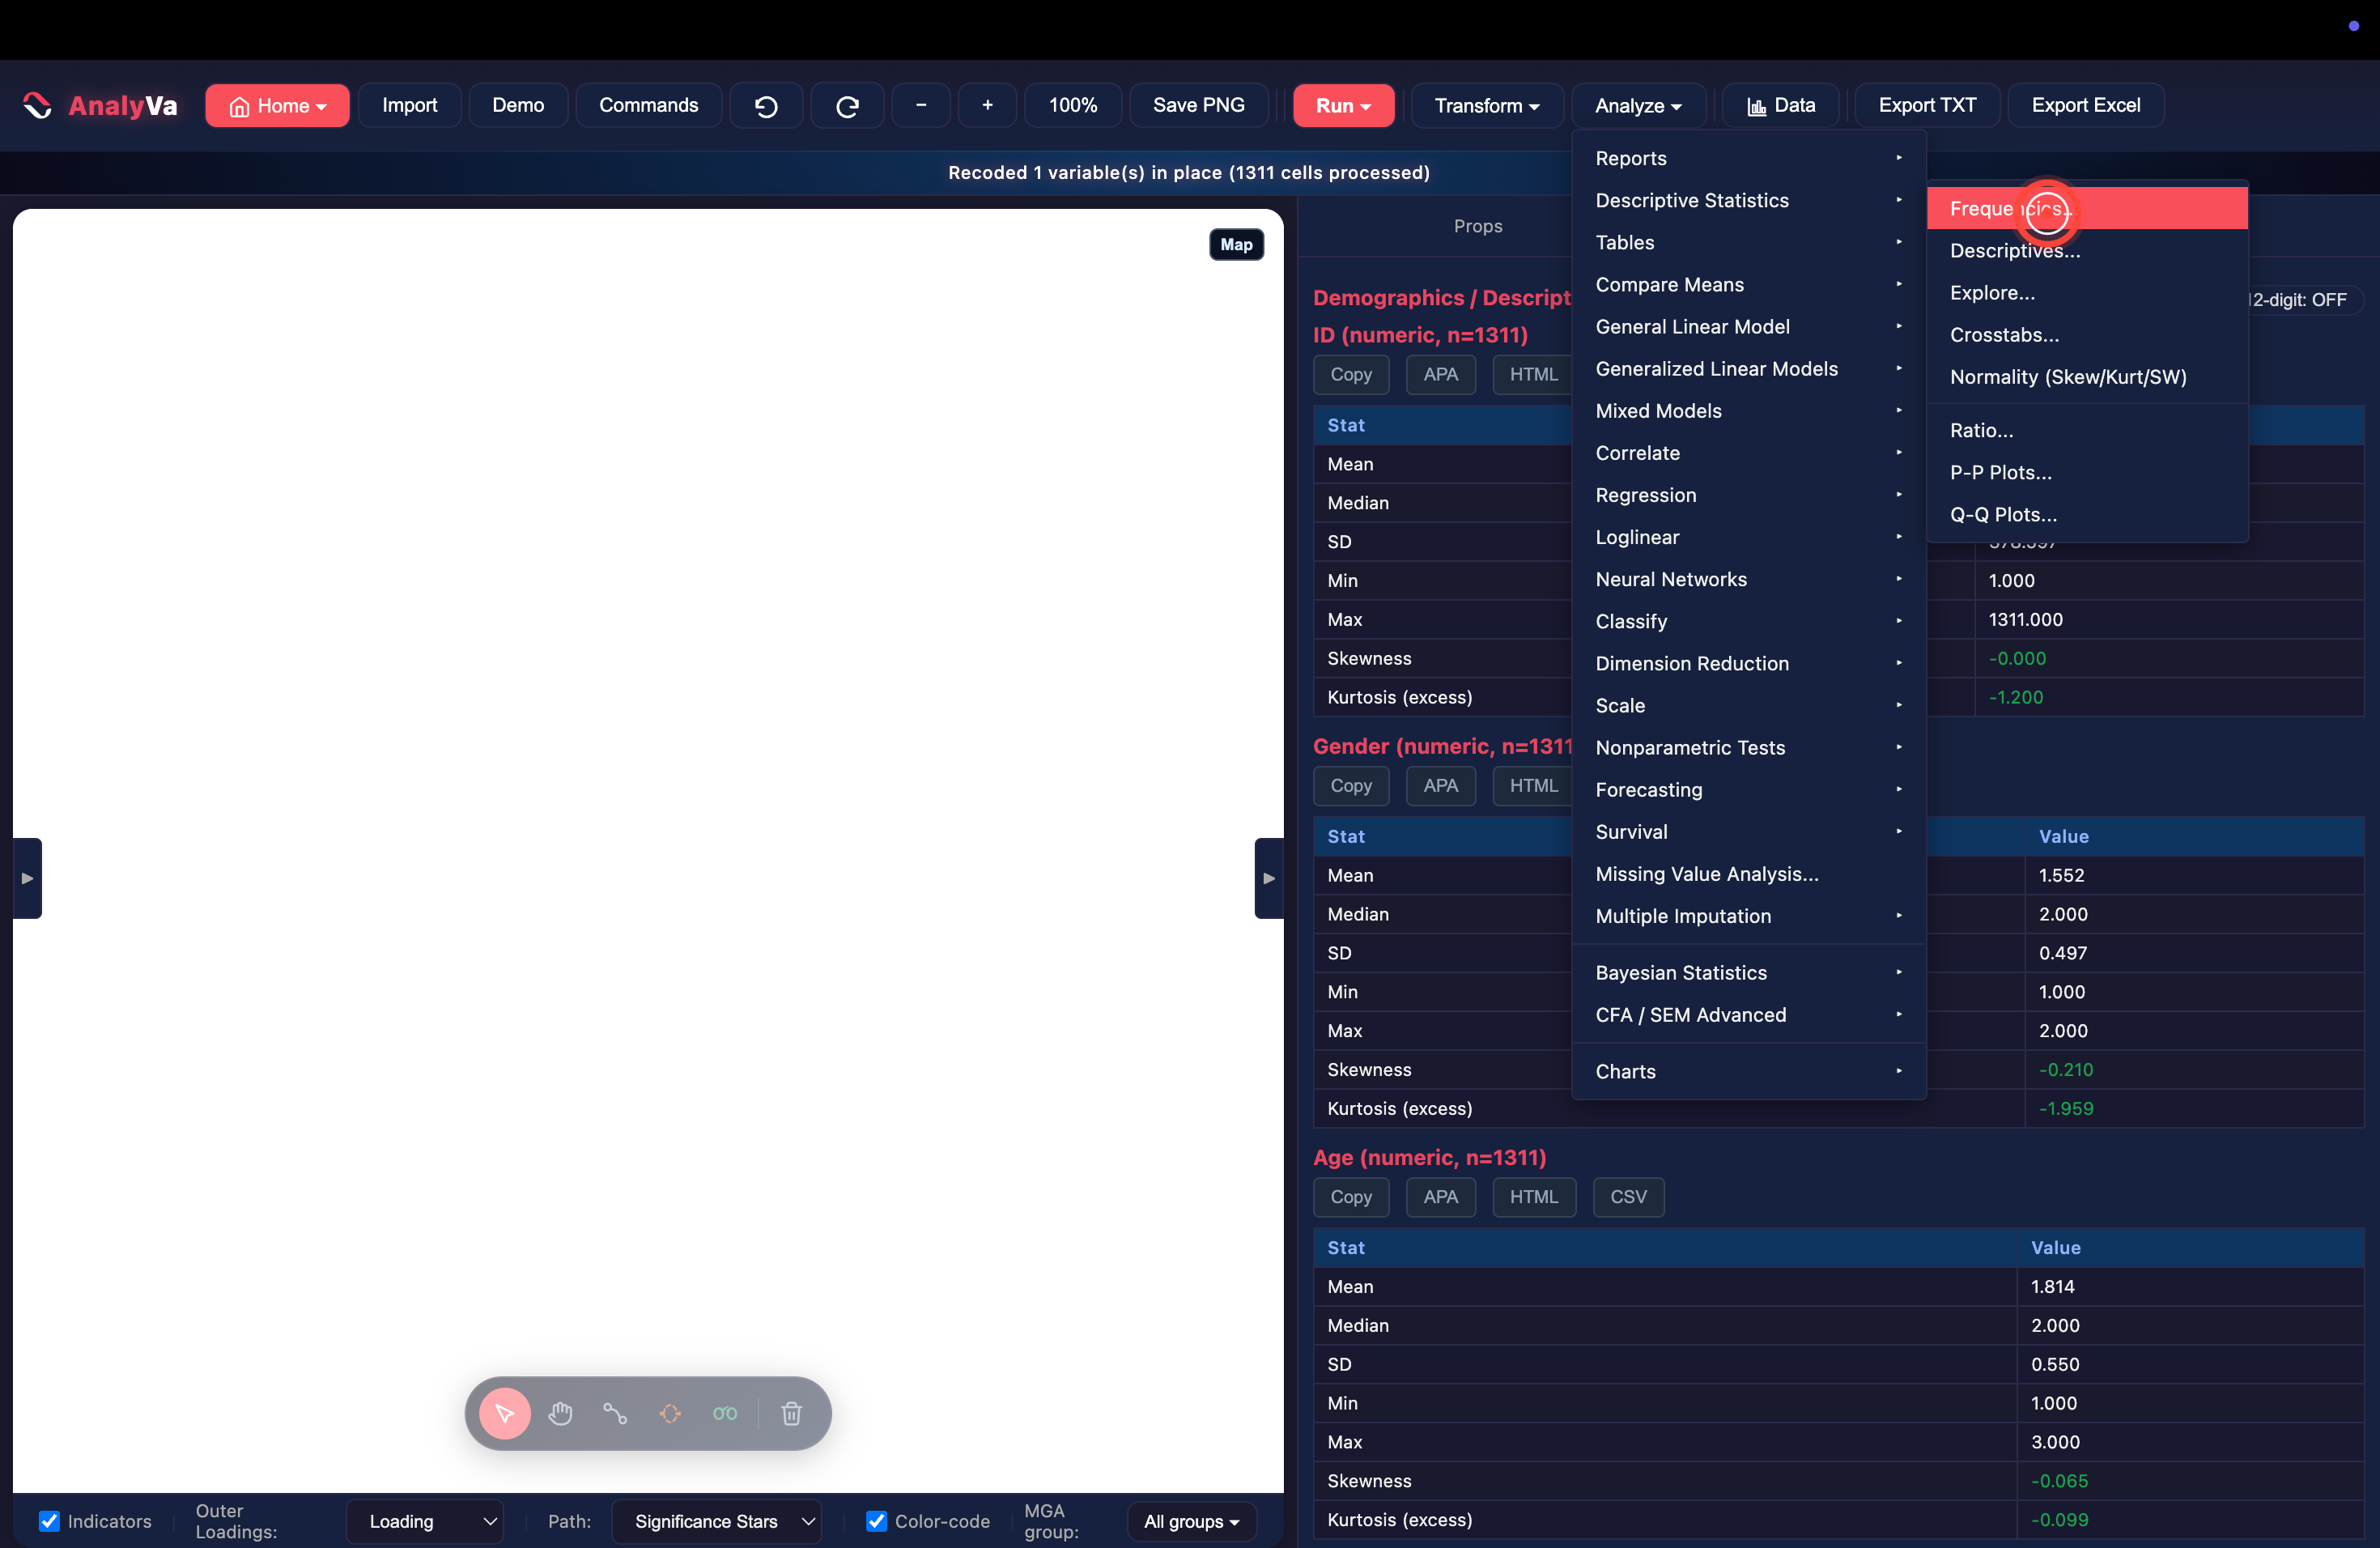
Step 6 — Open Analyze → Descriptive Statistics → Frequencies.
Step 7 — Select Gender and run. Tick Include bar chart and Include statistics to get both a distribution table and a visual.
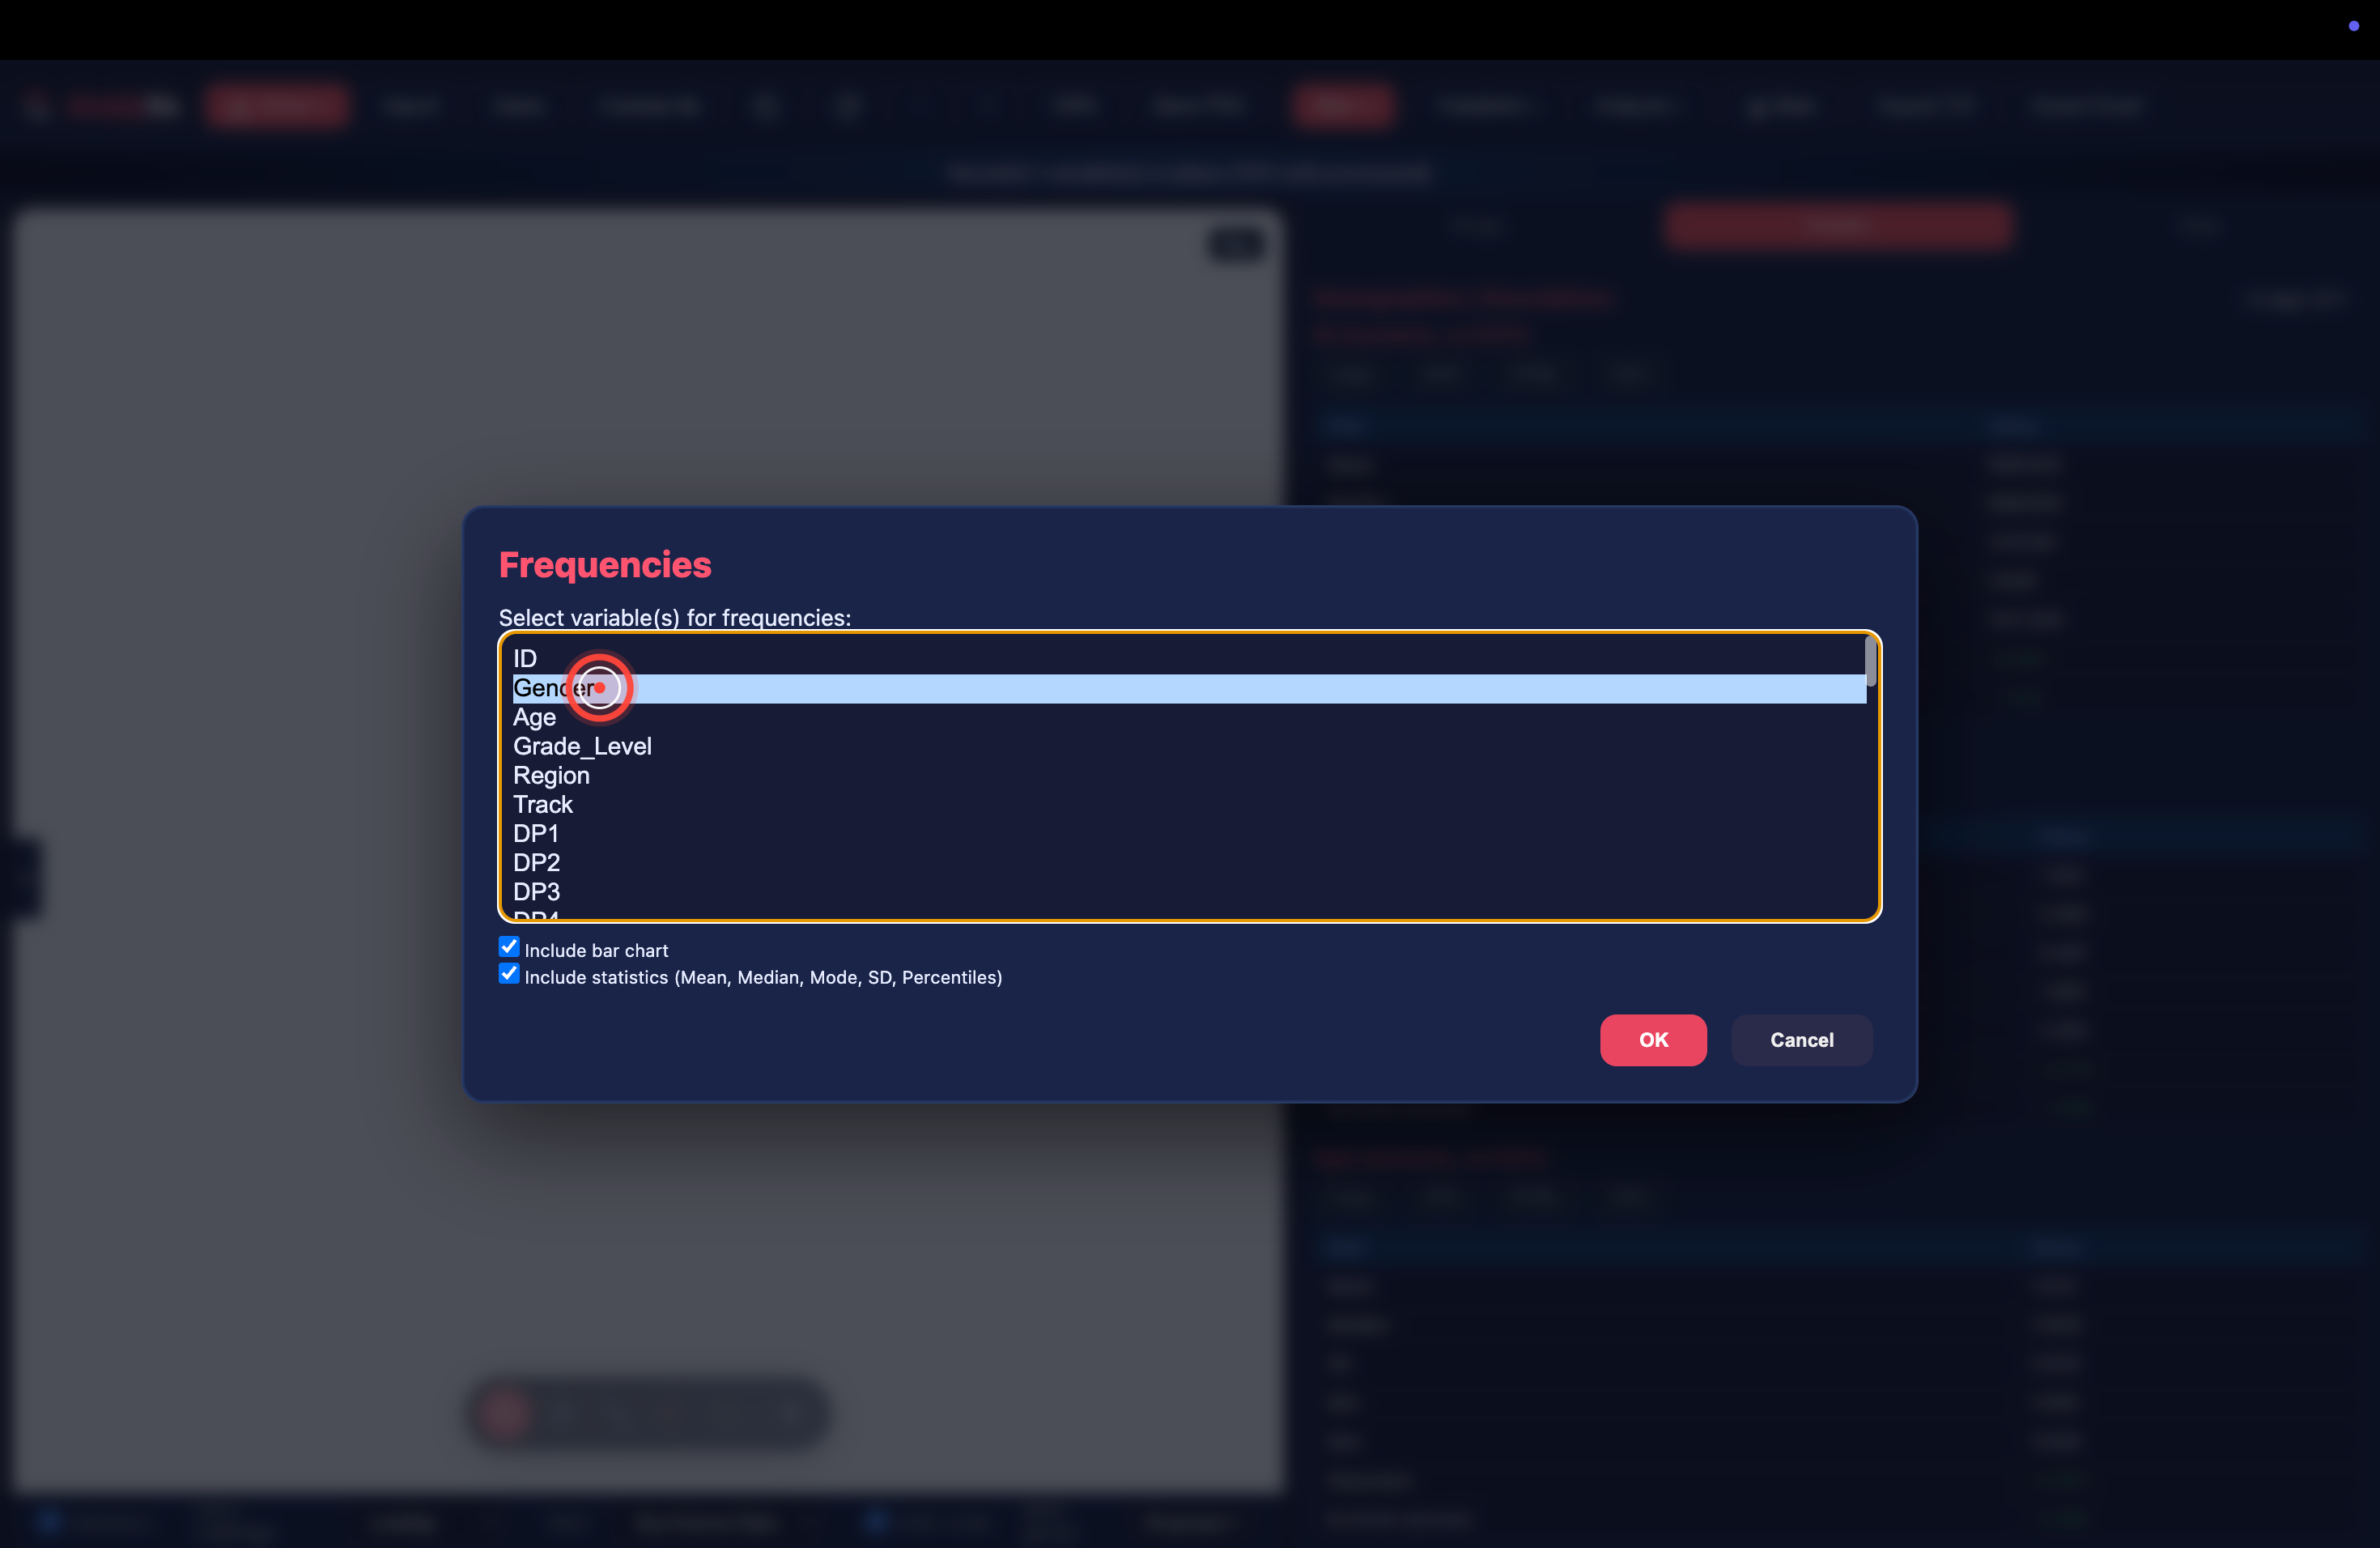
Step 8 — Click OK.

The output confirms the recode worked: 55.2% one label, 44.8% the
other, labeled — not 1 and 2 — in every subsequent table.
Running multi-group analysis
With a labeled grouping variable confirmed, the PLS-SEM dialog can
split the estimation by group. AnalyVa’s built-in TAM demo dataset
already ships with a two-construct model (PU, PEOU) and its own
Gender variable, which makes it a fast way to see the grouped-run
option end to end — the same Group data sets control works
identically on your own recoded variable.
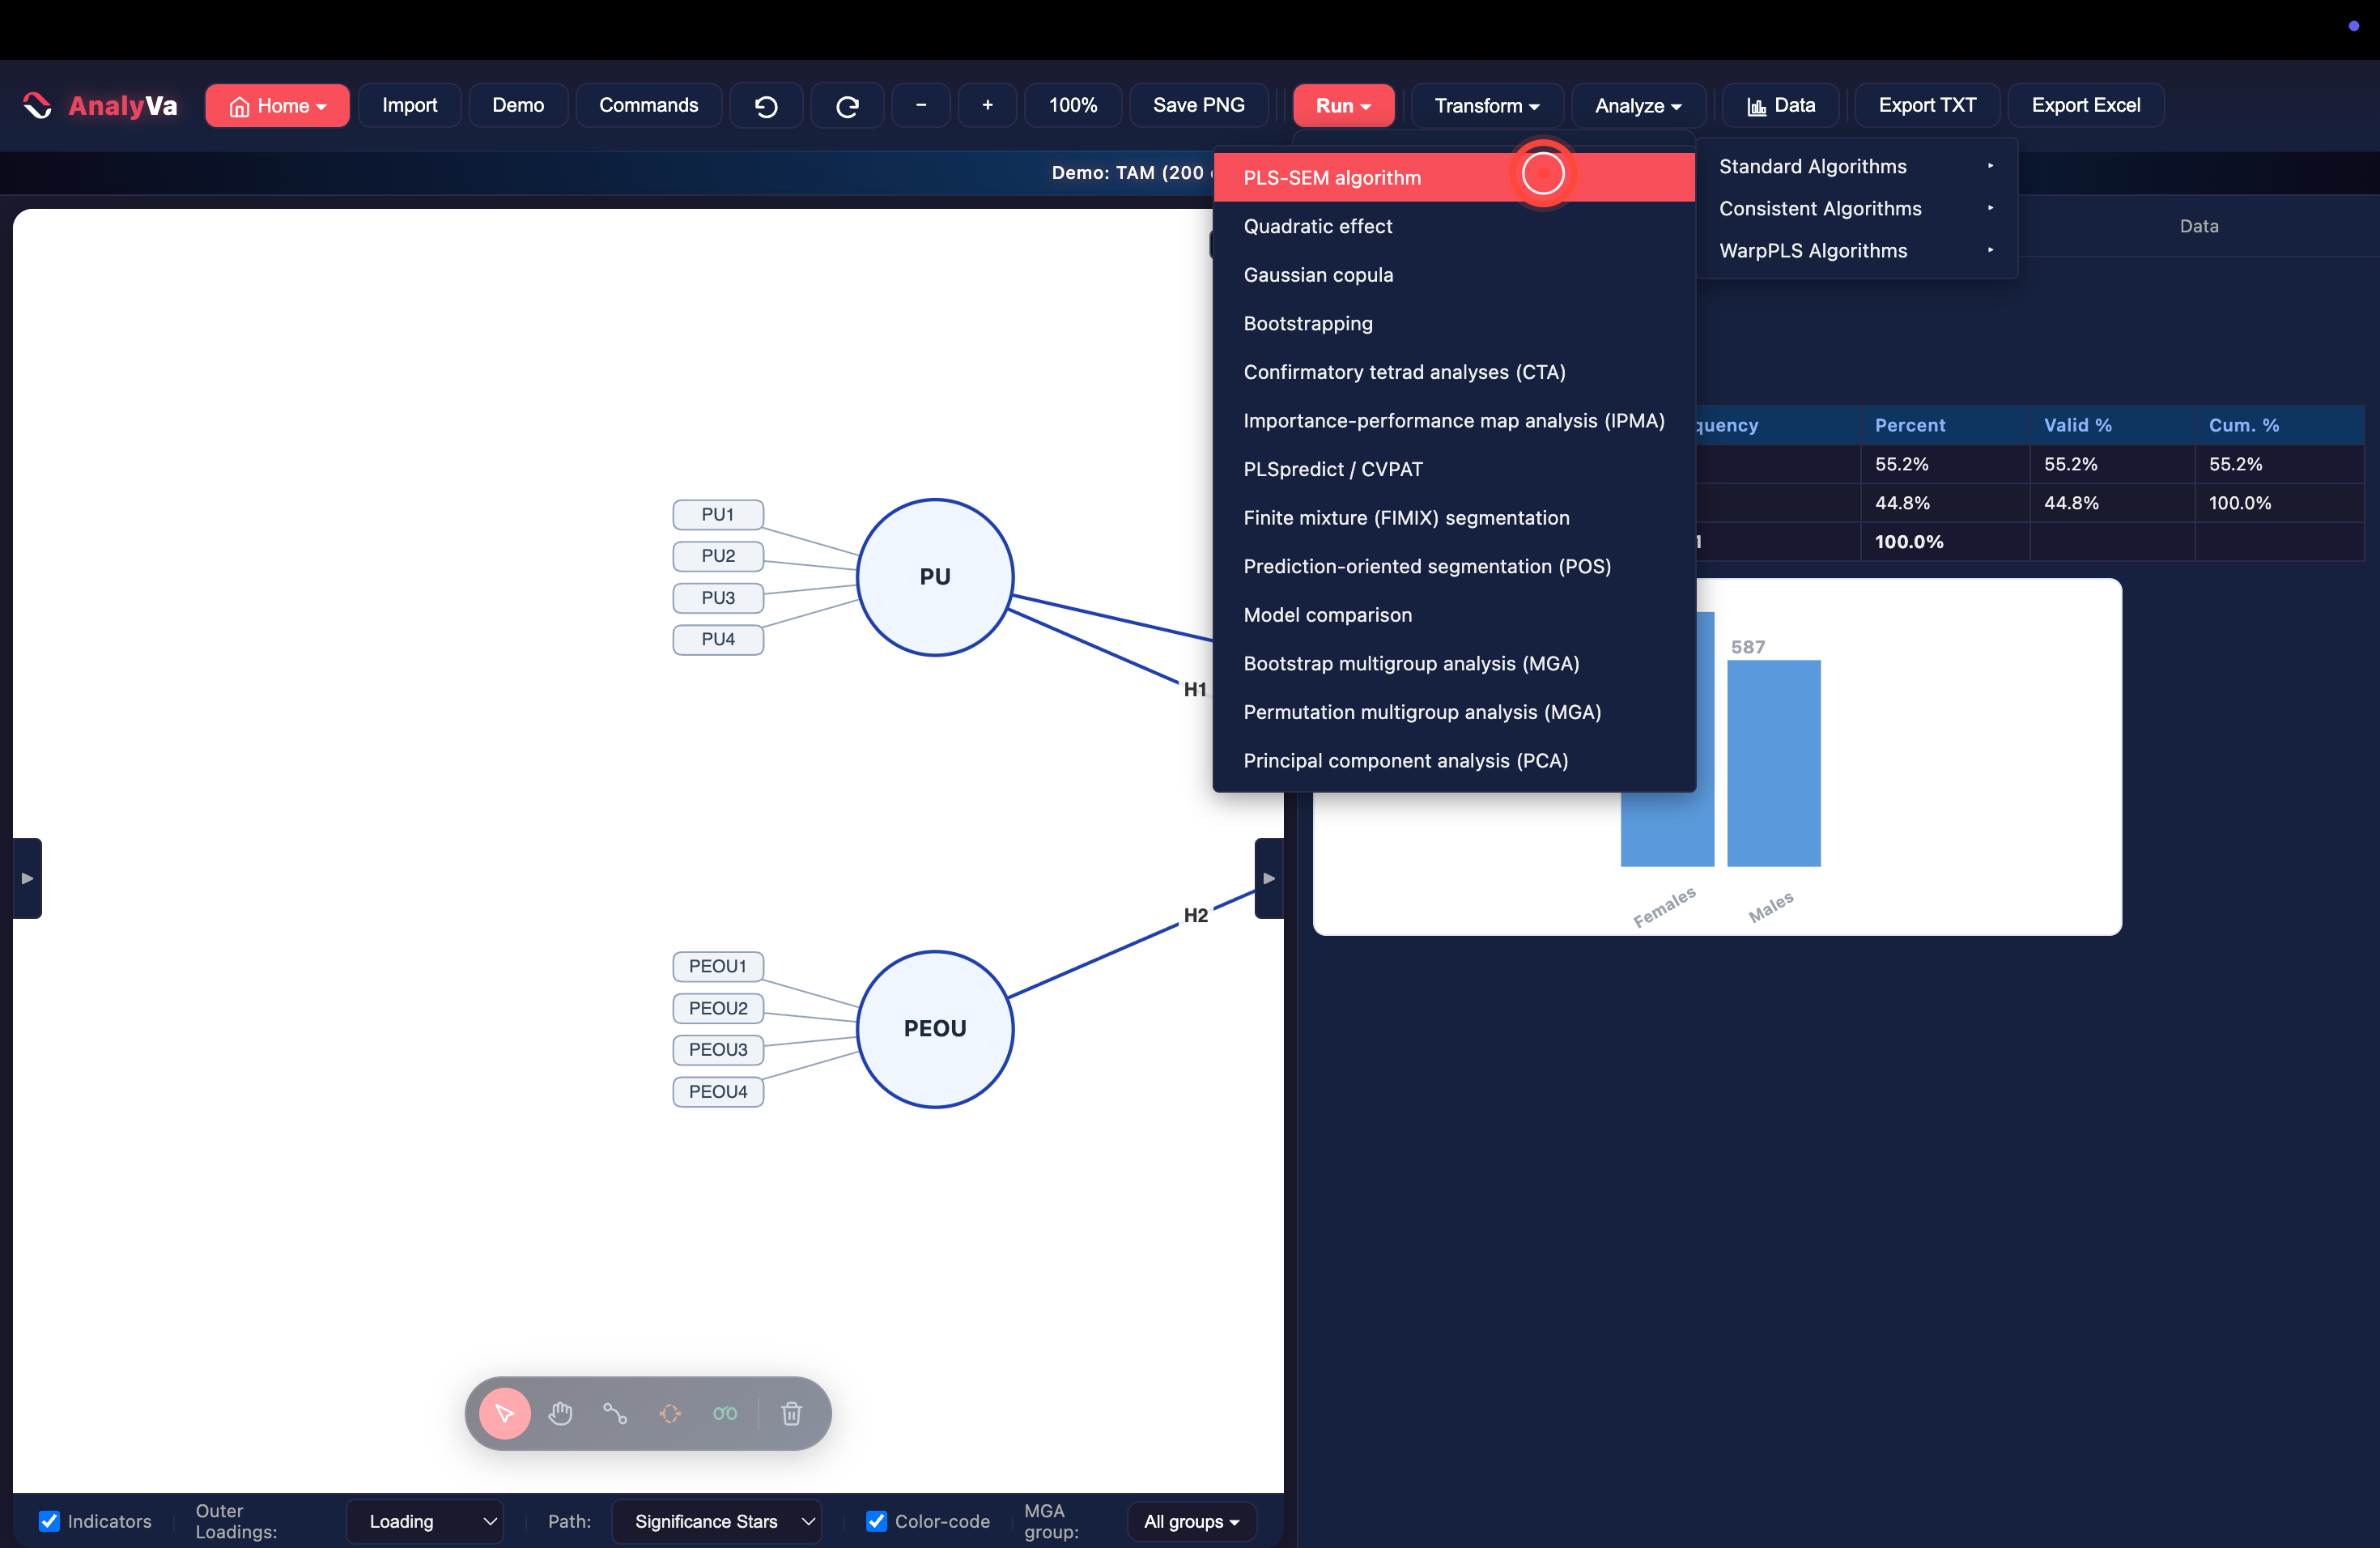
Step 9 — Open Run → PLS-SEM on a model with a grouping variable available. The full PLS-SEM submenu includes both Bootstrap multigroup analysis (MGA) and Permutation multigroup analysis (MGA) as dedicated significance tests for group differences — useful once the basic grouped run below establishes there’s a difference worth testing.
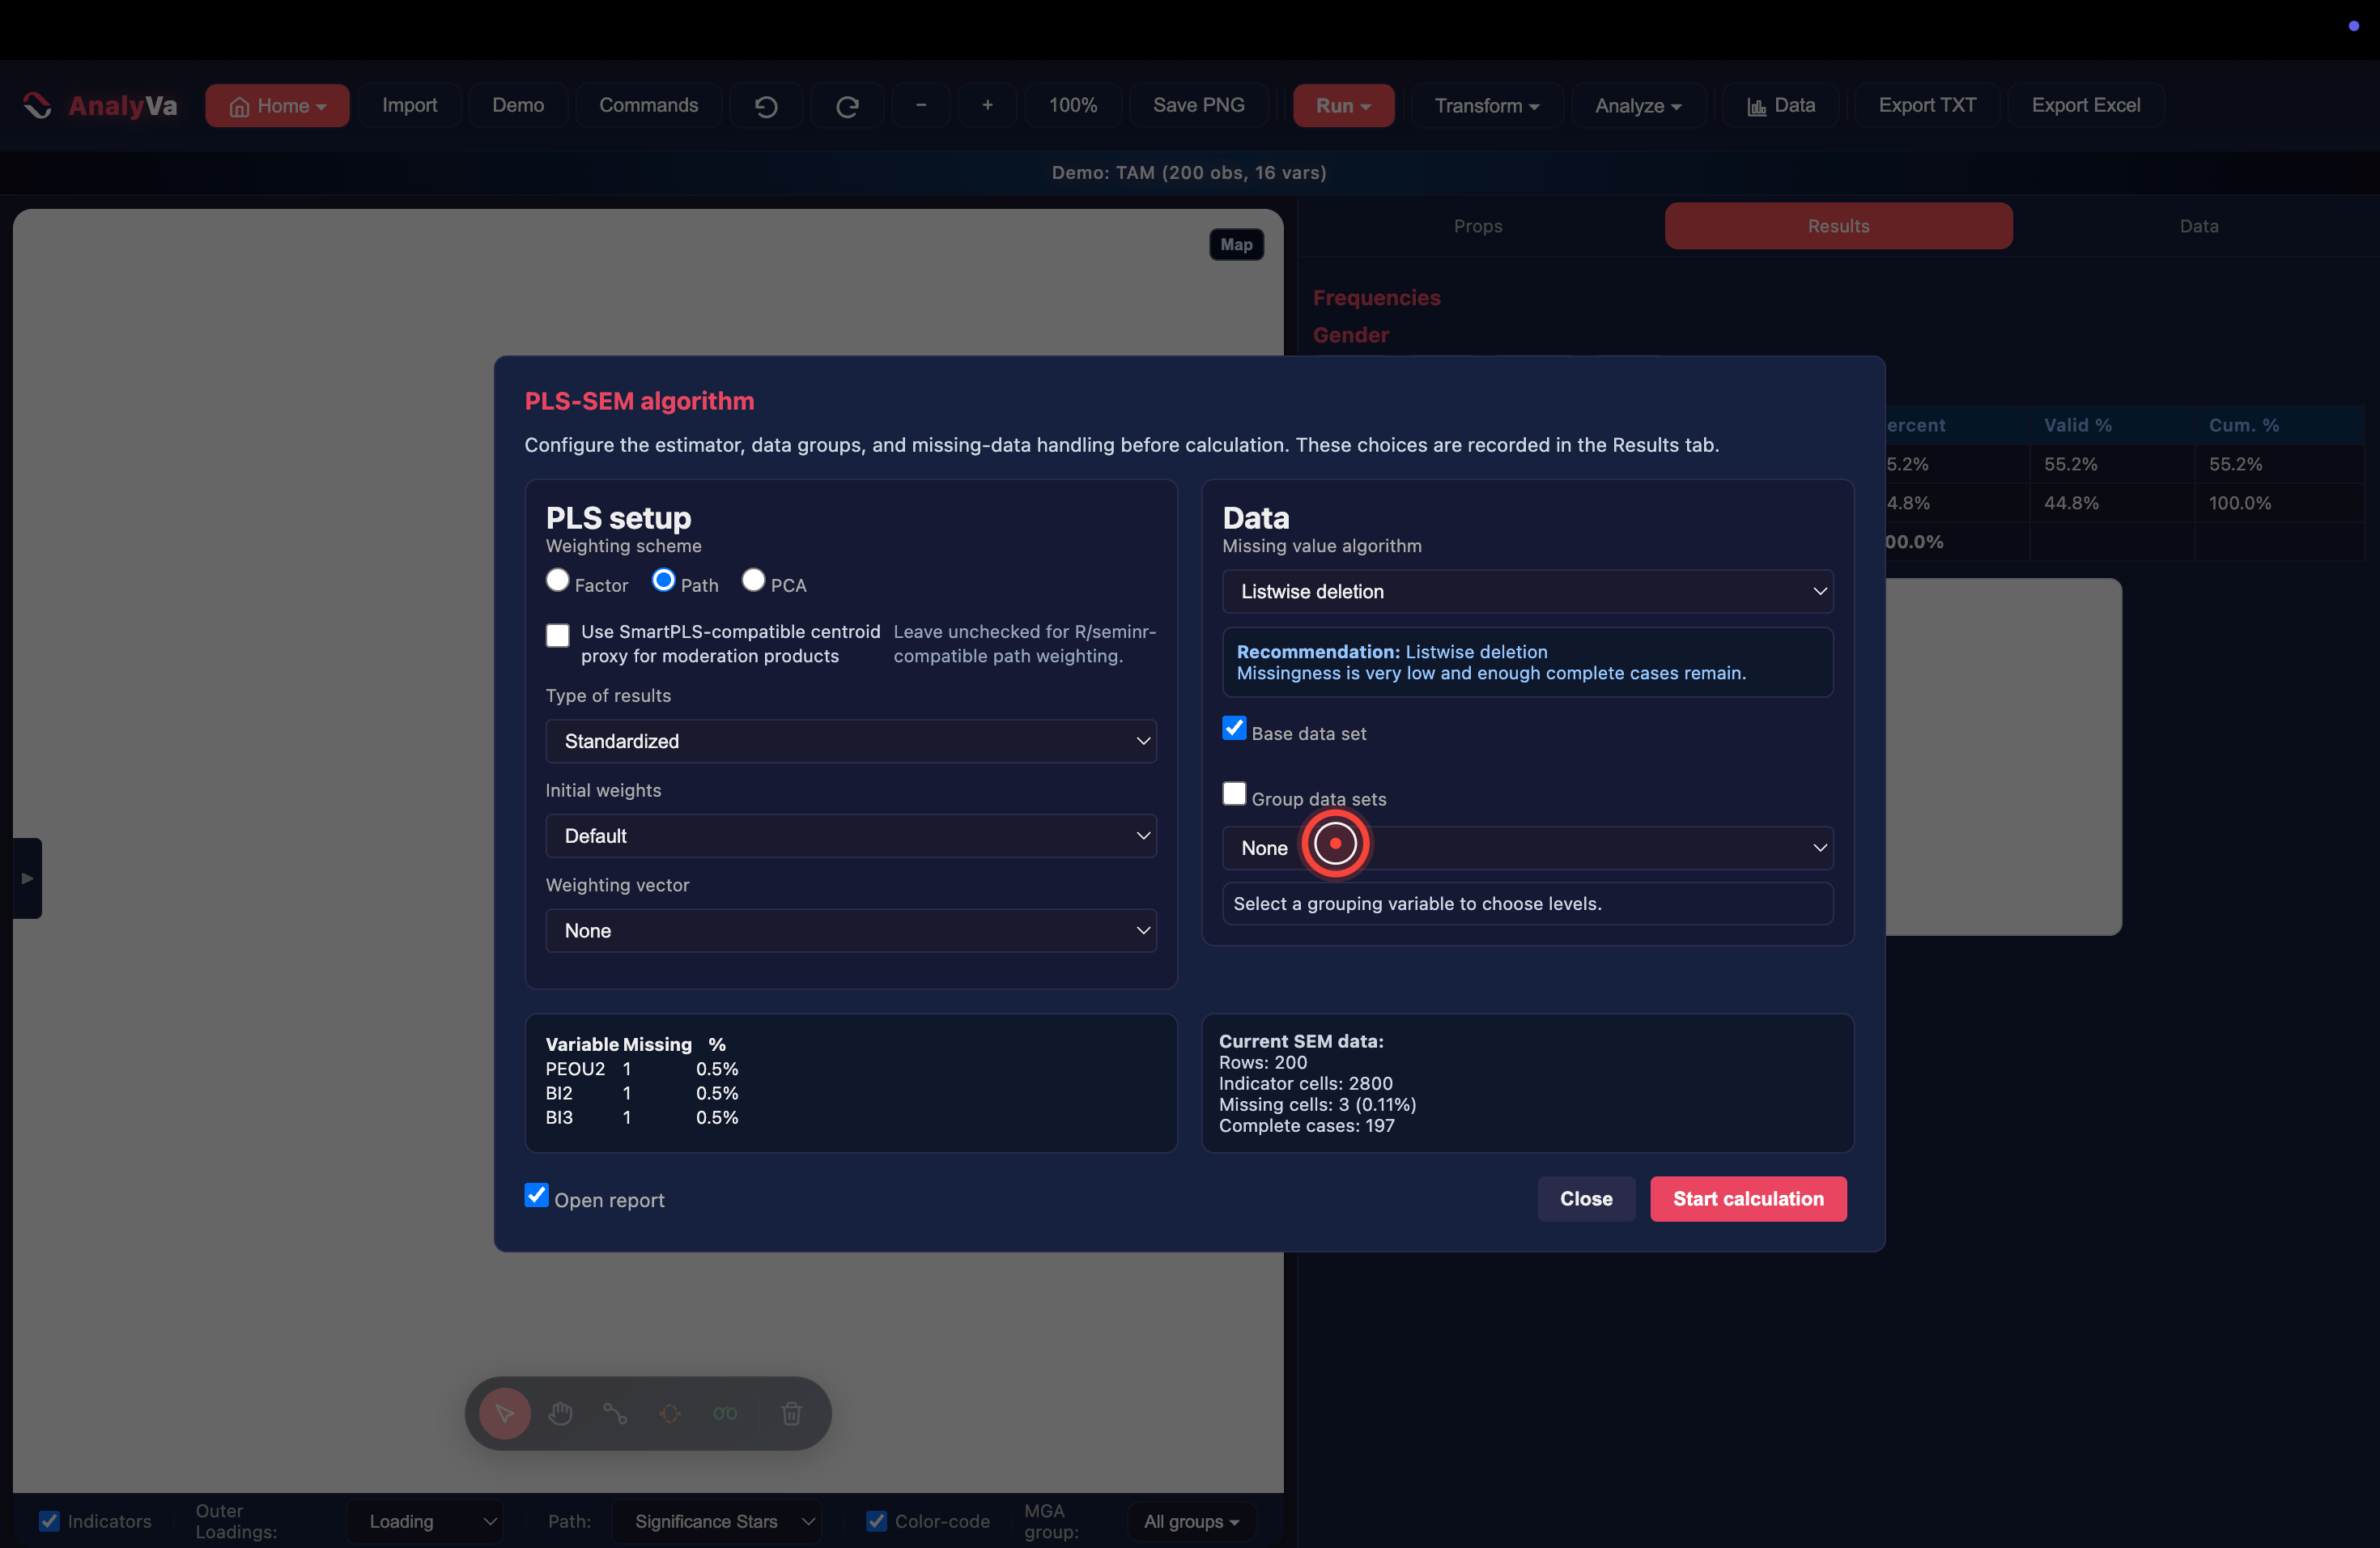
Step 10 — Open the PLS-SEM algorithm dialog. By default, Group data sets is unchecked and the dropdown reads None — the algorithm runs on the full sample.
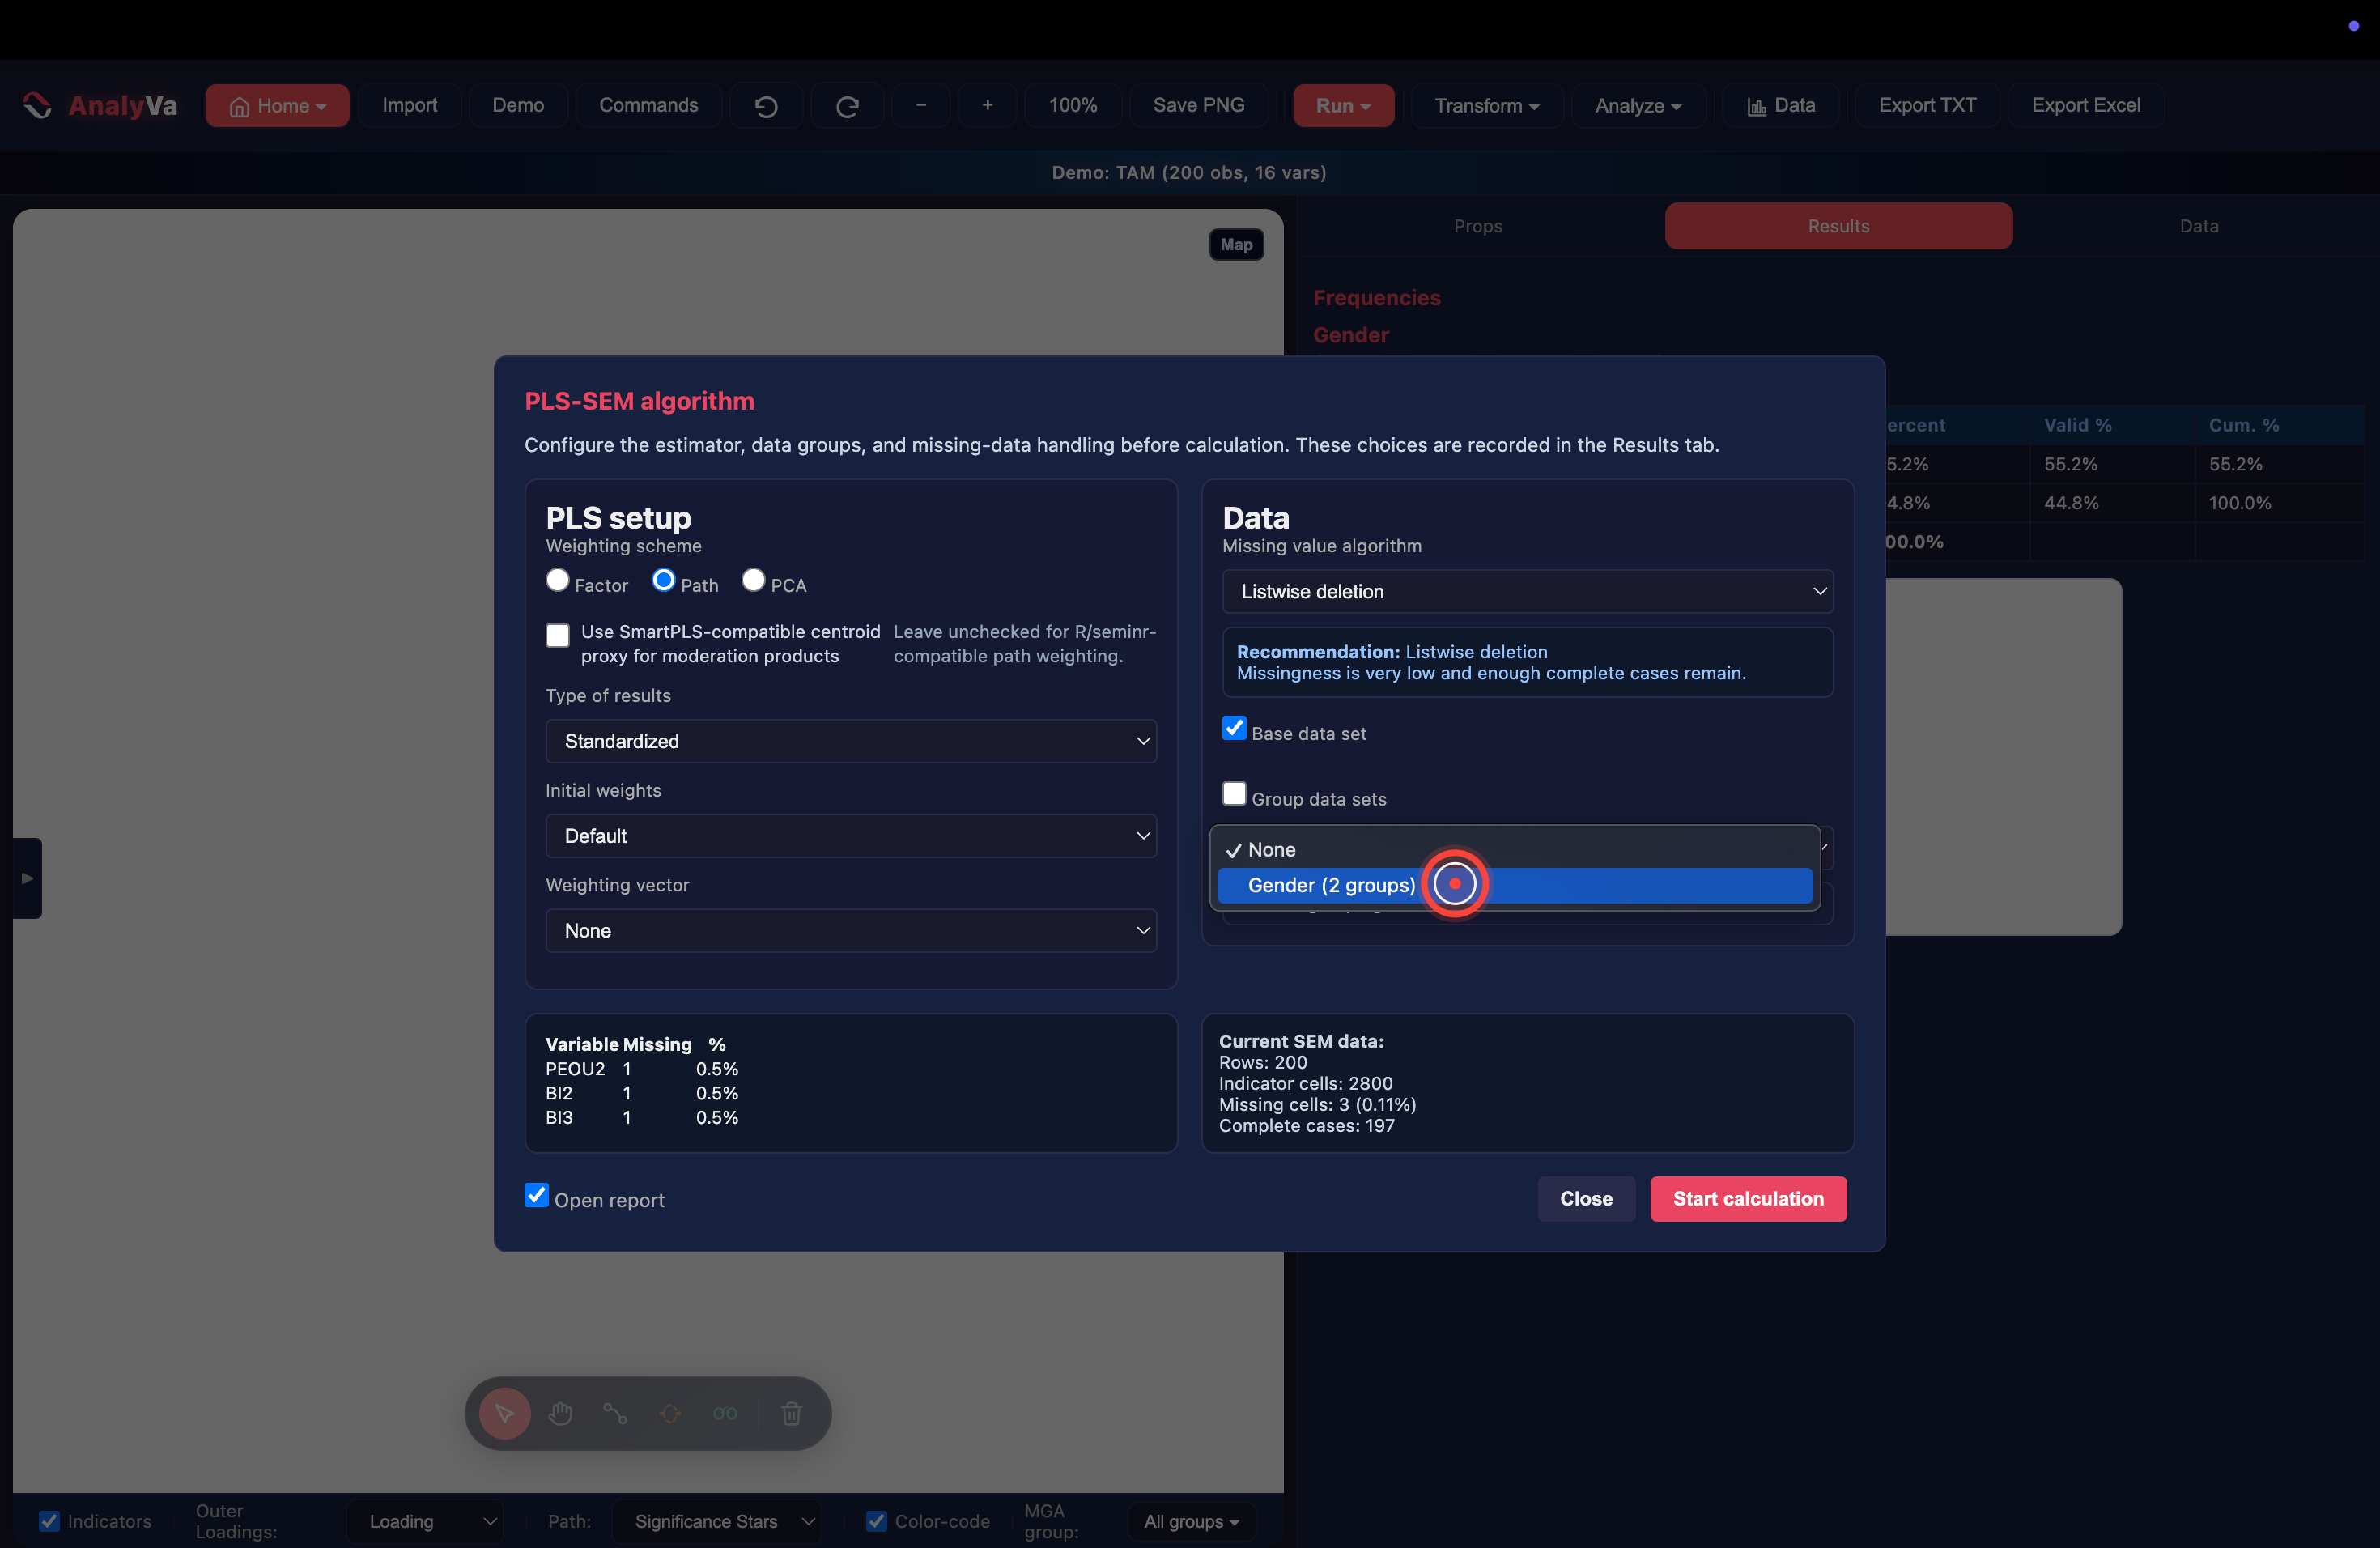
Step 11 — Tick Group data sets and pick the grouping variable. Once checked, the dropdown lists every eligible categorical variable in the dataset. Select Gender (2 groups).
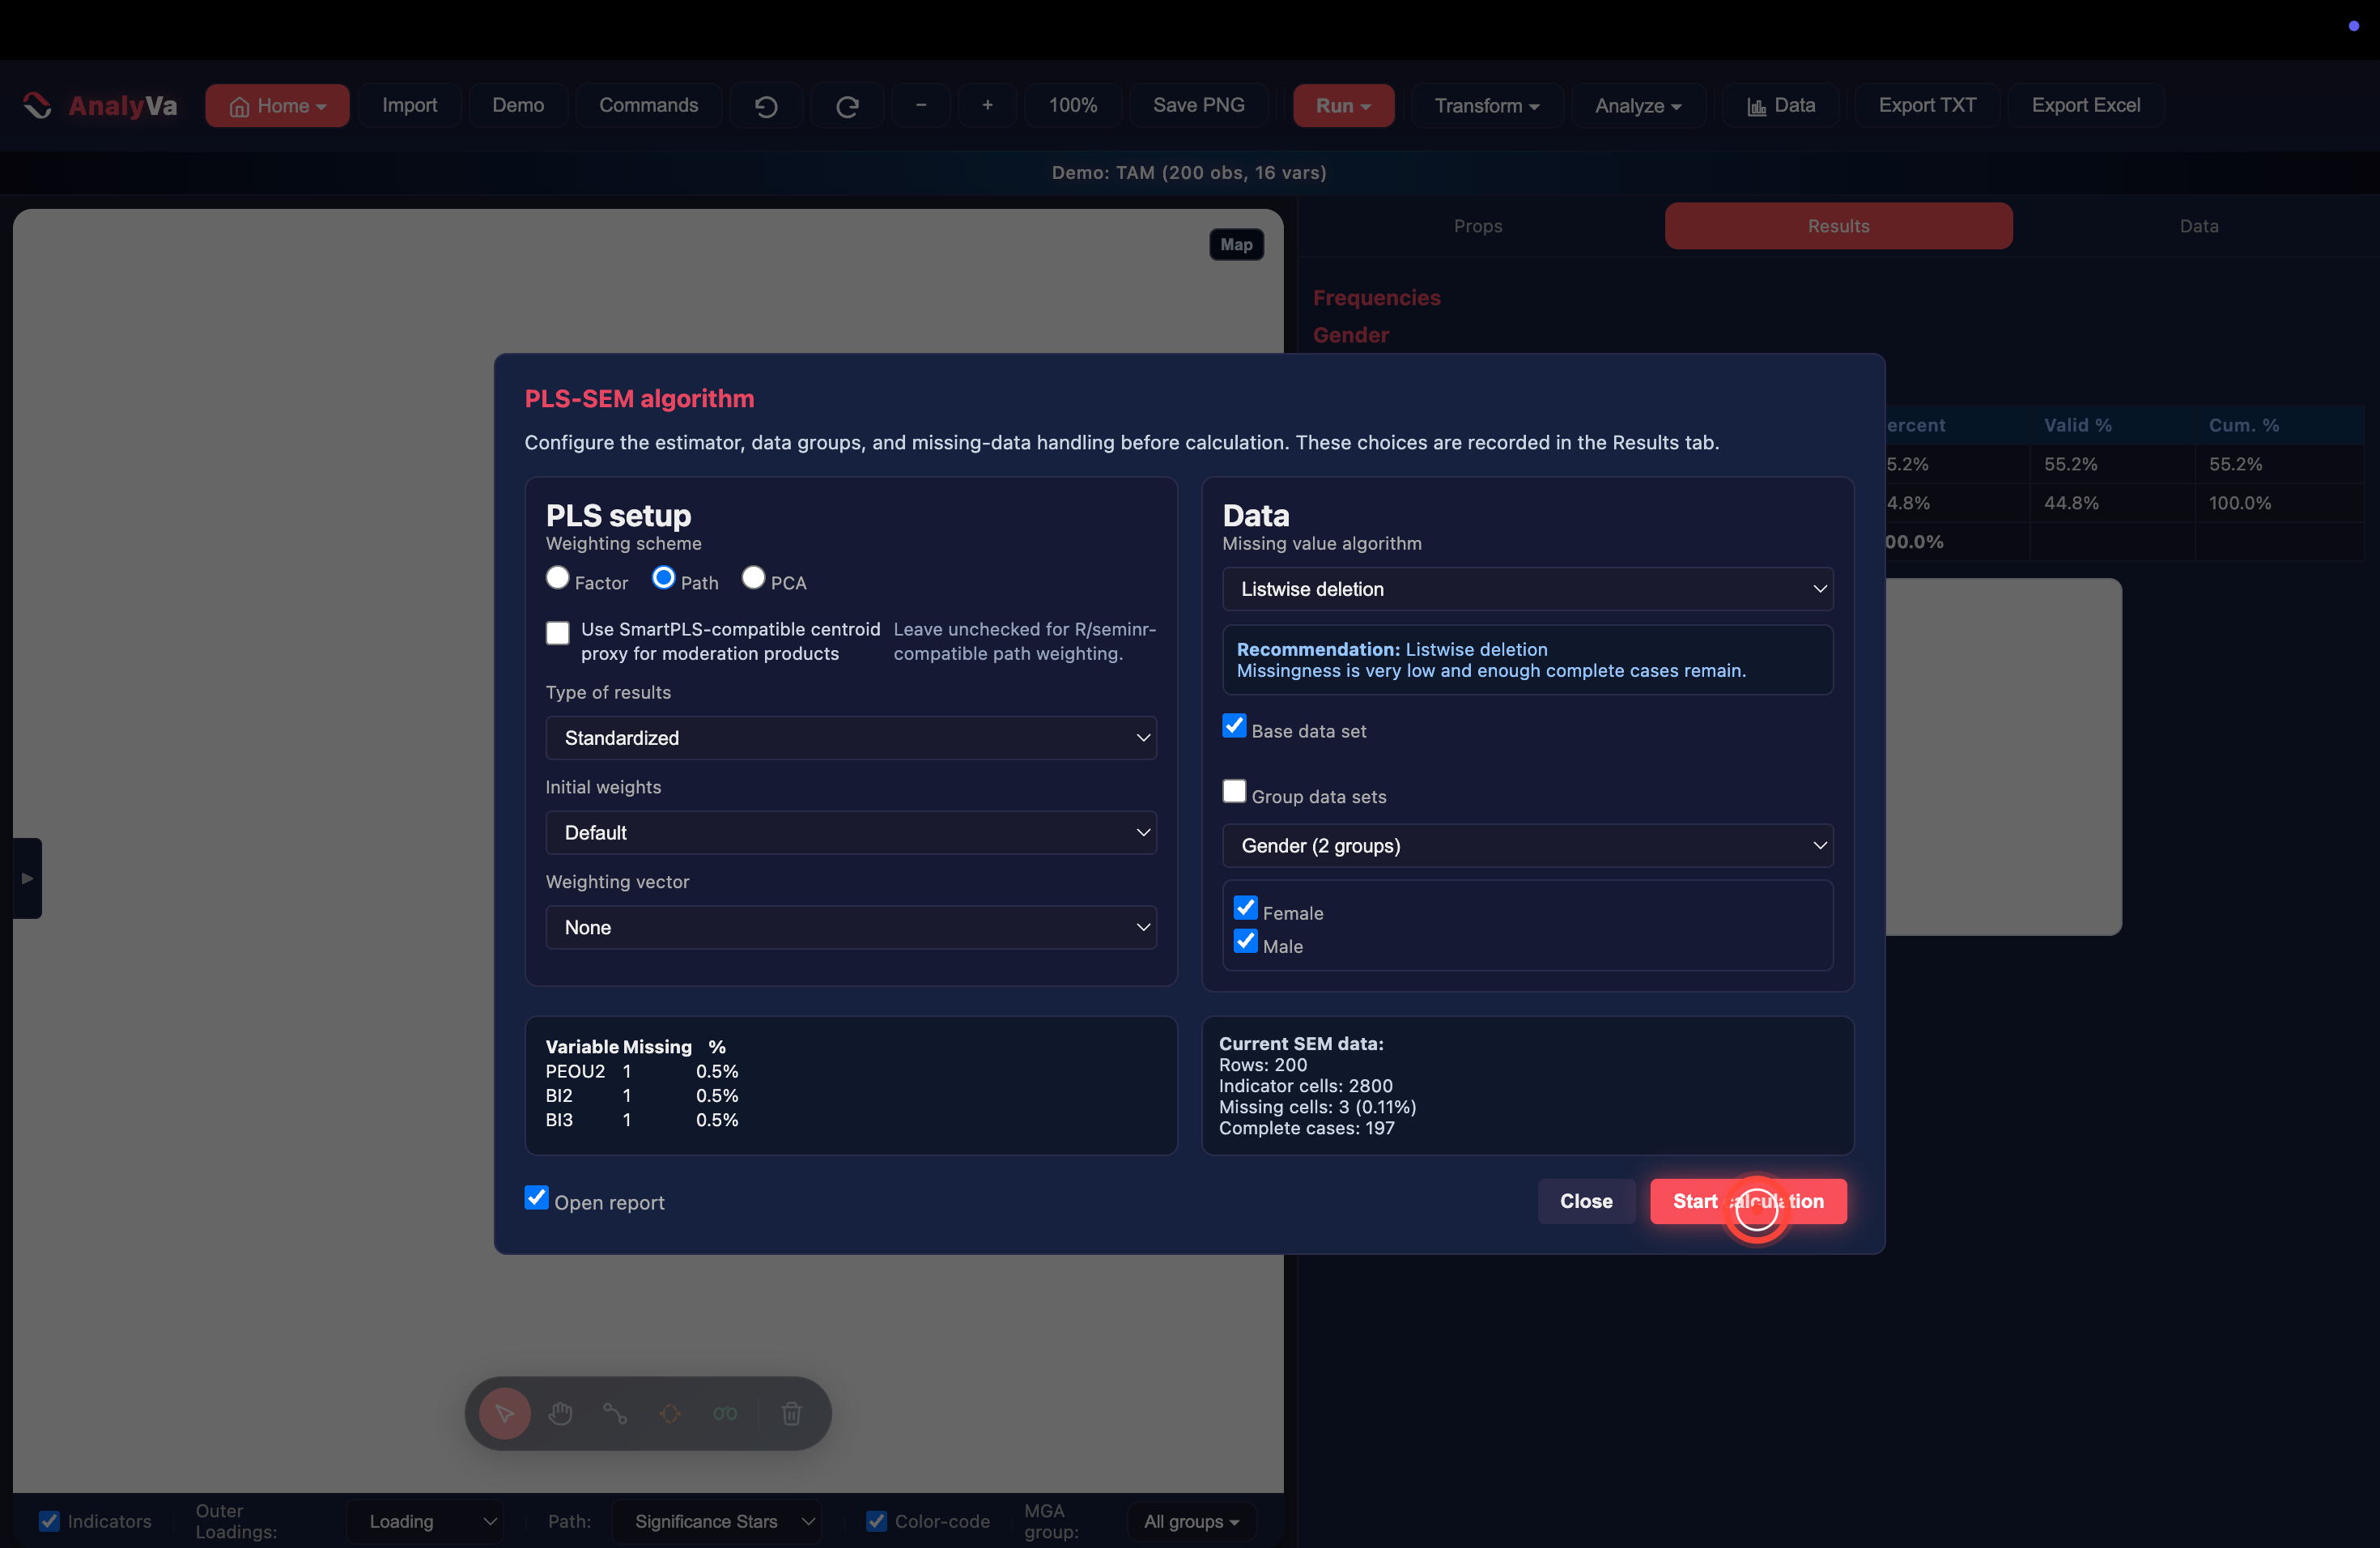
Step 12 — Confirm both levels and Start calculation. Checkboxes for Female and Male appear, both ticked by default — uncheck either to run a single-group subset instead of a full comparison. Leave both checked and click Start calculation.
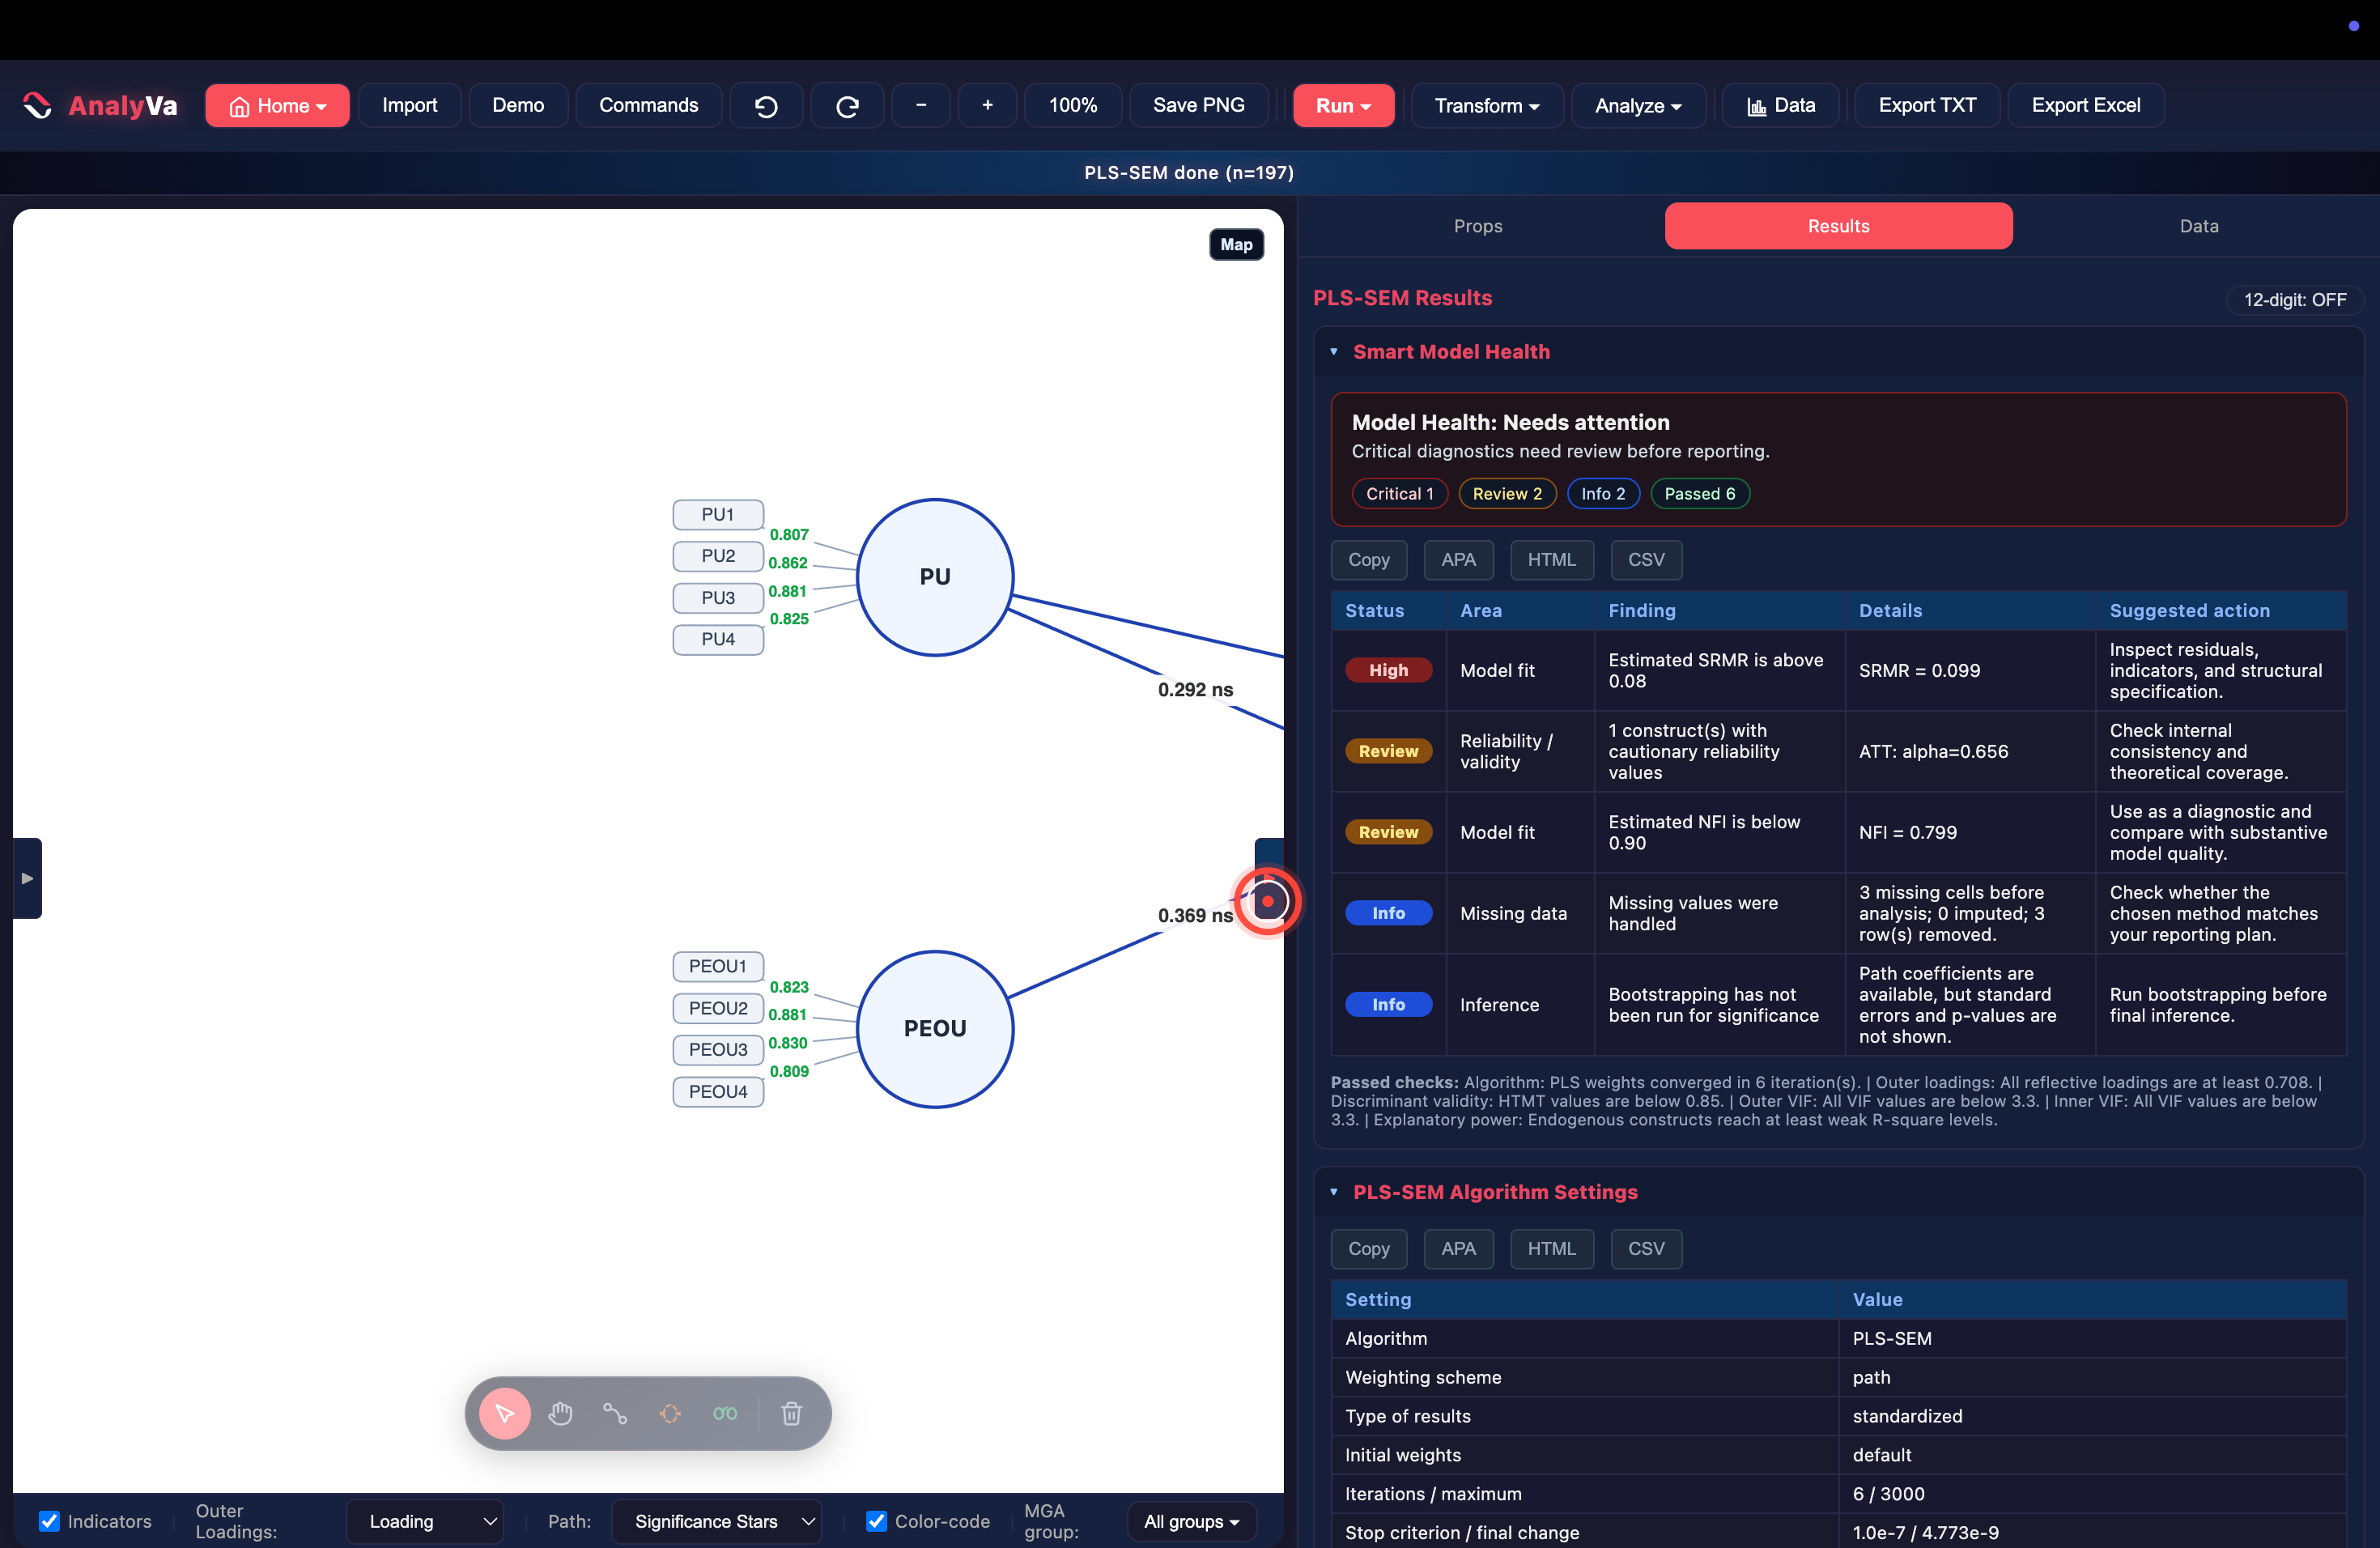
Step 13 — Read the result. AnalyVa reports “PLS-SEM done (n=197)” — the complete-case count after listwise deletion — and opens straight into the Smart Model Health panel, which flags model fit and reliability issues before you even look at group-specific coefficients. A group selector (MGA group: All groups) at the bottom toolbar lets you flip the canvas between the pooled model and each group’s own path diagram.
What comes next
A grouped PLS-SEM run gives you two sets of path coefficients side by side, but eyeballing a difference between 0.32 and 0.41 isn’t a significance test. That’s what Bootstrap MGA and Permutation MGA — both visible in the Run menu above — are for: they resample within each group and report whether the path difference survives inference. Run the basic grouped estimation first to see whether a difference is worth testing, then reach for one of the two MGA procedures to confirm it statistically.